Heat Map Filters
Bonus! The Platform remembers your Preferences!
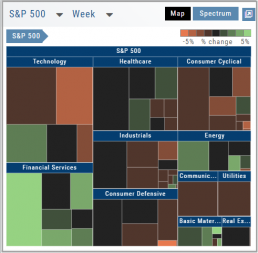
Select the view you like and it will be saved during your current session – even when you navigate elsewhere on the platform. The system will remember the map/spectrum view you set. This includes the type and time period as well.
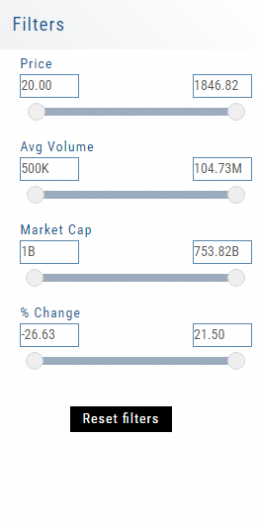
Streamline your results by using the Filters for Price, Average Volume, Market Cap, and more. The data will be displayed dynamically based on filter changes. You can set your filters and the Platform will remember it until you change or reset it during the current session.
Quote Detail without leaving the List
A quick snapshot of a stock with navigational tools.
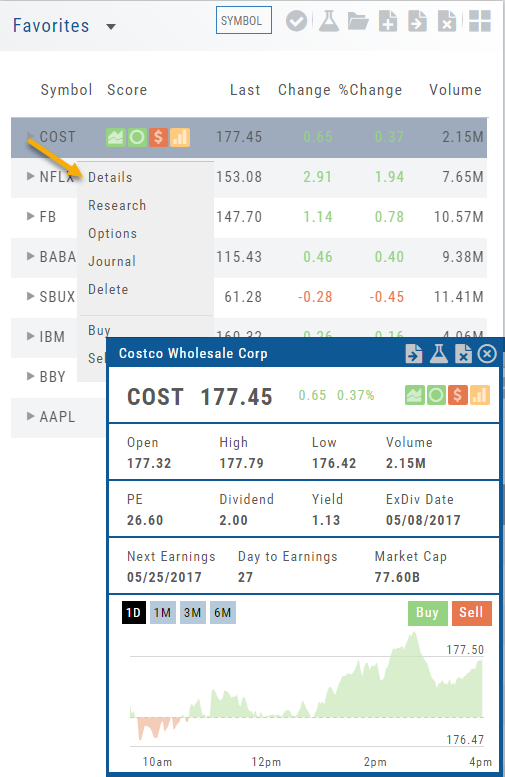
The Action Arrow Icon will provide a pop-up Quote Detail window including the current price, trading volume, Dividend Date -if applicable, Earnings Date and more. A chart, on the bottom part of the Detail Box, allows for difference periodices: 1 Day, 1,3 or 6 Months.
Notice the additional icons in the Quote Detail: You can send this stock to one of your Watch Lists, to Research or delete the stock if you wish. The Score Icons will direct you to the appropriate Research function. Buy/Sell buttons allow for quick order placing.
Explore - Give it a try!
From finding the best stock in the best sector to following where the money is flowing to and from, Heat Maps (and Spectrum, too!) offer insight both interesting and valuable.
Drill down for bullish, bearish and stagnant opportunities.