Rolling Positions
It’s easier & faster to evaluate your Trade
Once you have entered a position, you can easily make adjustments for further evaluation using the group of Rolling Icons in the upper-center part of the Option Table.
These icons will allow you to move the whole position: 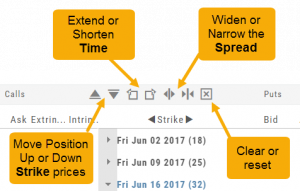
Up or Down Strike Prices
Extend or Shorten Time
Widen or Narrow the Spread
The [X] acts as a clear function. Clicking once will clear the current positions in the chain. Clicking a second time will act as “all clear”. This will clear any snapshot trades and fully reset the option chain.
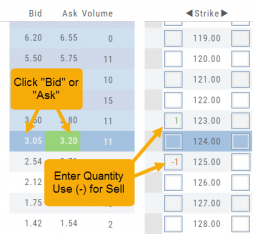
Entering a Position
You can enter a position to analyze by clicking on ‘Ask’ for buying or ‘Bid’ for selling. You can also directly enter the quantity in the entry box. (Note: make sure to indicate a selling position with a minus (-) sign).
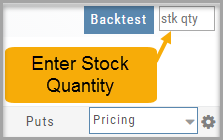
For positions that include the underlying stock, such as Covered Calls, Protective Puts & Collars, enter the stock quantity in the upper right corner of the chain window.
You can change the click quantity amount by changing the default-click parameter (found at the top of the Option Table) for 1x, 5x or 10x.
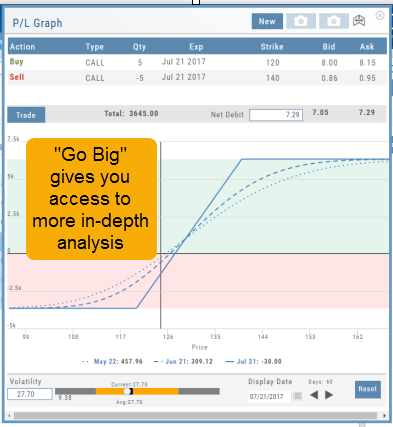
Go Big - Graphs & Charts
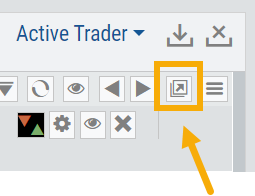
Anywhere you see the ‘Go Big’ icon ![]() , you can expand the graphic and access additional information.
, you can expand the graphic and access additional information.
The Chart Tab under Research has such a button in the icon toolbar as shown:
The Heat Map on the Market Tab will allow you to filter criteria such as stock price, volume, market cap, etc. 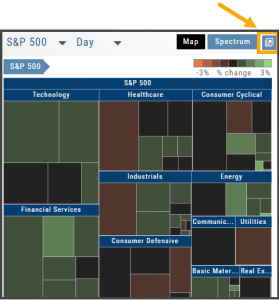
In the Options Tab, you can do this with the P/L Graph and the Volatility Chart. The icon is located at or near the upper right of the graph or chart.
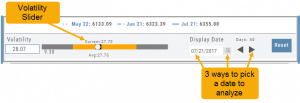
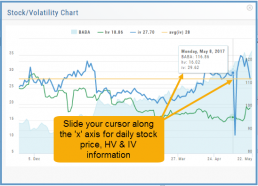
Expanding the Stock/Volatility Chart allows you to view past Historic Volatility, Intrinsic Volatility and stock price on a day-to-day basis.
For deeper Trade Analysis, use the Volatility Slider tool and the Date Picker, located at the bottom of the P&L Graph:
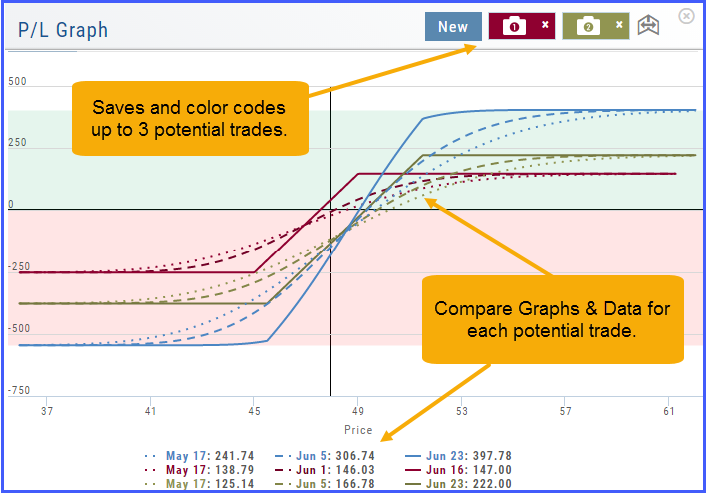
Profit/Loss Graphs
Any position entered in the Options Chain (Calls+Puts, Calls or Puts) will automatically display a profit/loss risk graph. The P/L Graph shows the Trade Profile Performance from the current day.
You can compare up to three (3) positions on one graph by utilizing the Camera Icons. Once you complete one trade scenario, click the first camera then click ‘New’. Structure your second trade scenario, click on the second camera. To add a third scenario, click new to structure an additional trade. The graphs will overlay.
Trade from the Options Tab
Trading from the Options Table is easy!
When a position is set up on the Option Chain or from one of the Strategy Templates, simply click the “Trade” button.
The Position will be sent to the Order Ticket where you can further edit:
- Adjust Price between “Mid” and “Nat”
- Change Duration: Day or Good Til Cancelled
- Change Order Type: Limit, Market, etc.
- Click “Review” to confirm Order Details and Account are correct
- Then “Submit” to send to brokerage.
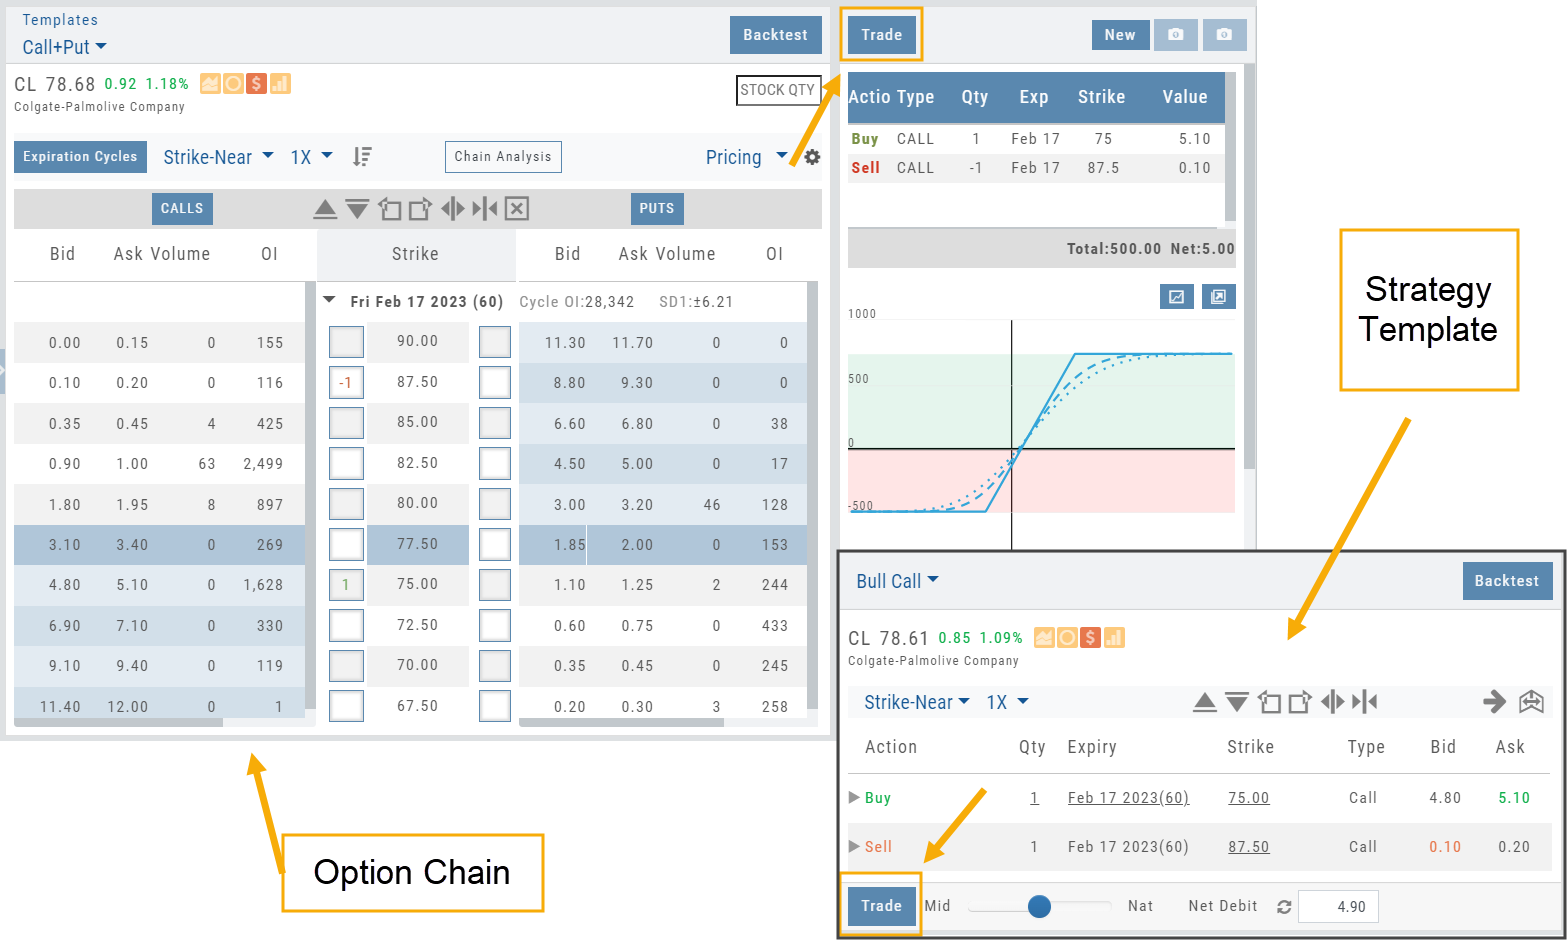
Trading from the Option Template
From Template to trade is easy. 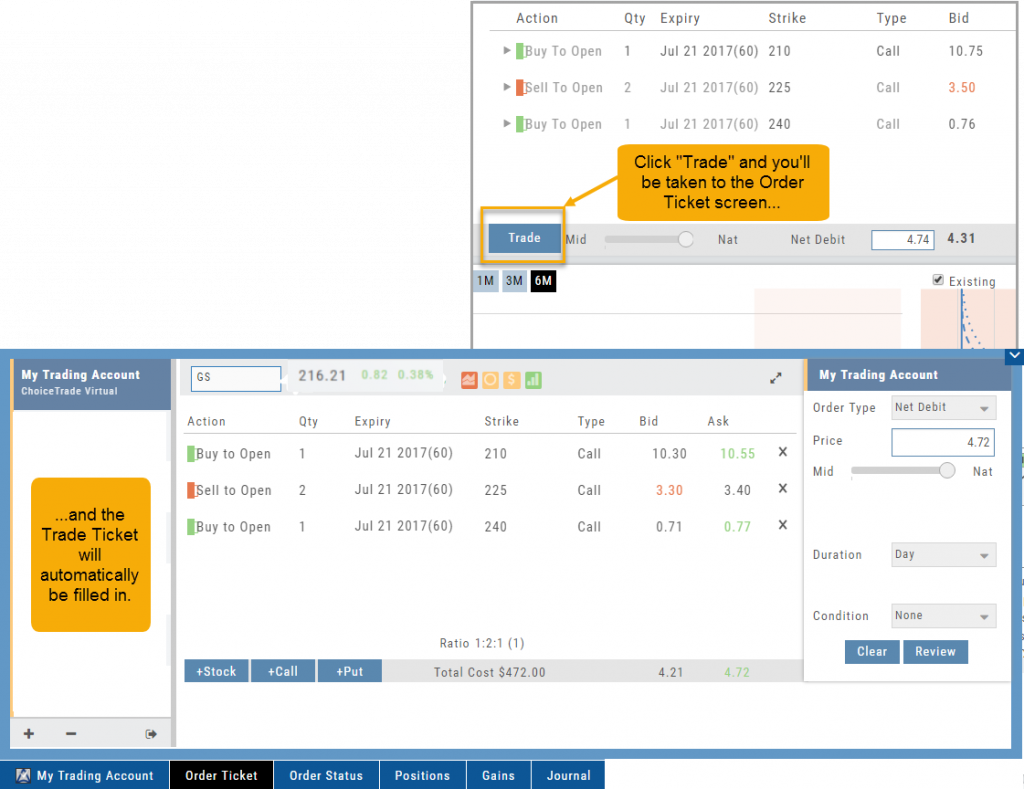
Simply click the “Trade” button on the Option Template and the Order Ticket will be filled in for you. This not only saves time, but eliminates order entry errors.
You can connect directly to select brokerage firms right from the platform and execute the trade.
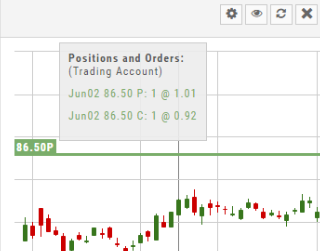
Working Orders Displayed on Chart
Charts display working orders and existing positions of selected brokerage accounts, currently Choice Trade and TD Ameritrade. More brokerages will be forthcoming.
- Stocks show a horizontal line at the entry price.
- Options show a horizontal line at the strike price.
- Green for Long and Red for Short.
The group of 4 icons, located above the Working Order, allow you to Edit (Gear), Hide(Eye) Refresh (Circle arrows) or Remove (X).
![]()
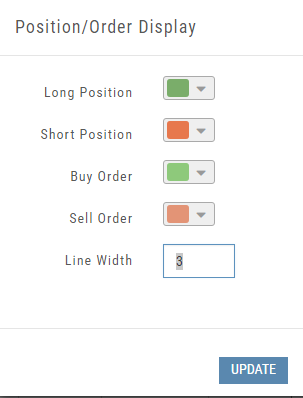
Display choices including colors and line width are available in settings by clicking the “Gear” Icon.