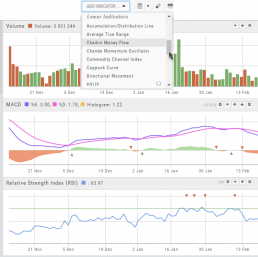
Lower Indicators
The “Add Indicator” drop-down box has a section of Lower Indicators you can add below the main chart.
Many of the Indicators allow you to customize the parameters prior to adding.
Once the Indicators are in place, the icon tool bar – found on the upper right above each graph- gives you the ability to edit (Gear), hide (Eye), move up/down (Arrows) or delete (X) to truly customize your view.
![]()
Adding & Arranging Indicators
Select ![]() to add to your studies.
to add to your studies.
Indicators are grouped by Upper Indicators (which will appear on the Chart) and Lower Indicators (listed below the chart)
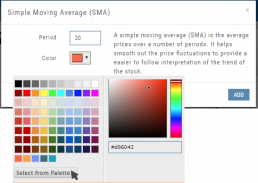
Once selected, you can customize the parameters – including the type of line you want for Moving Averages.
The upper Indicator selection summary appears above the chart and has an associated toolbar that allows edits (gear) hide/display(eye), refresh, or remove.. ![]()
Lower indicators can be displayed/hidden, move placement up/down, or delete it to truly customize your view. ![]()
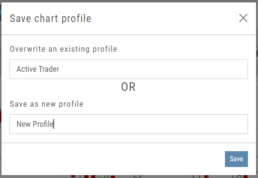
Make sure to Save Your New Chart Settings ![]()
Note: You cannot alter System Views: Active Trader, Options or Standard View. You will be prompted to either Overwrite or Save as a New Profile another available profile, such as Default or another Personal View.
Customizing Indicators
Customize Indicator Settings – even in different Chart Profiles!
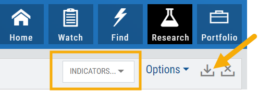
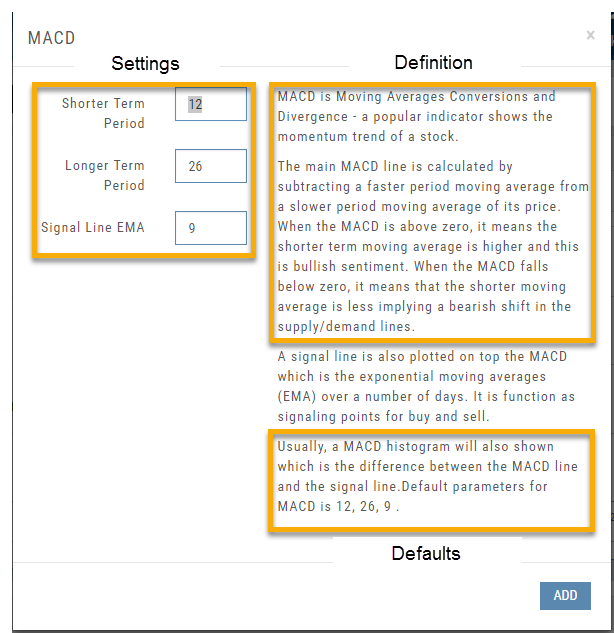
Customize the settings by clicking on the “Add Indicator” box at the top, center of the screen. Scroll to the Indicator you wish to add/edit. Left-click on the selection for a customization box to appear.
The Indicator window shows which settings can be changed.
Bonus! You can save different settings for the same indicator in different chart profiles. No need to change settings from one profile to the next.
In addition to the settings, this feature also provides a description of the indicator and the default settings.
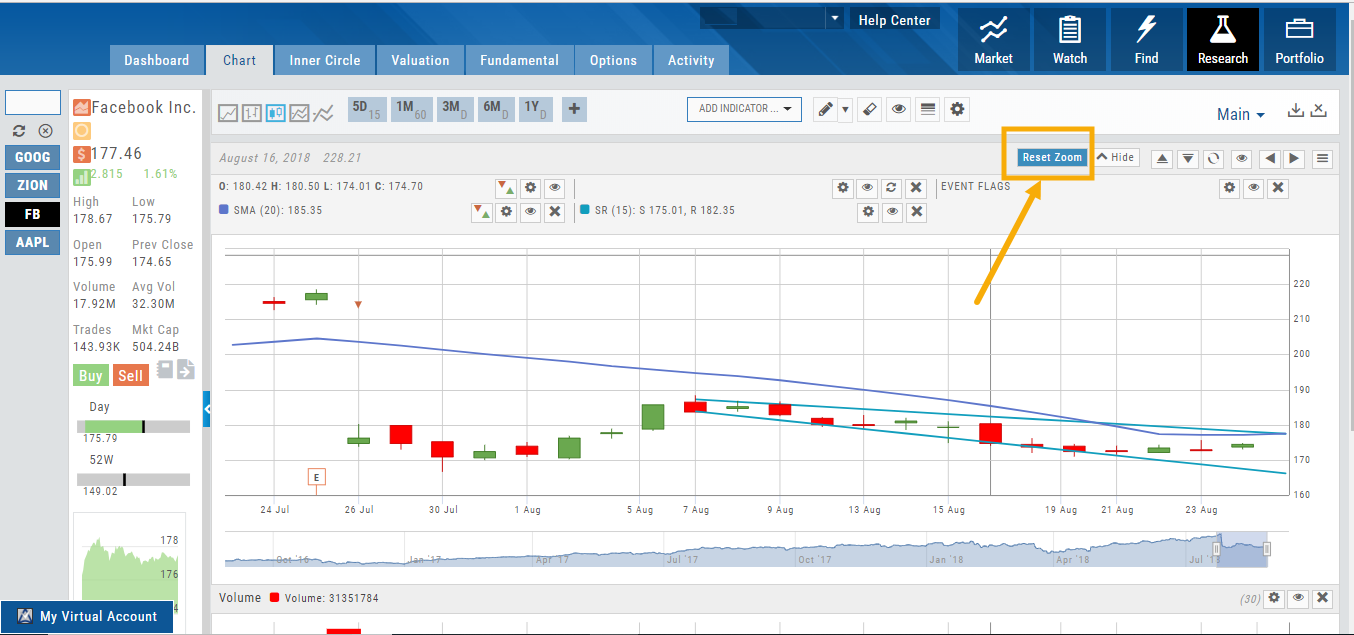
Zoom Feature
Activate the Zoom Feature on the Chart by clicking on the Icon as shown:
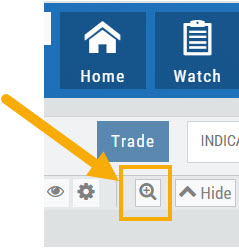
The icon will darken when activated – or, depending on your theme, may show up brighter: ![]()
You can then “Click/Drag” your cursor.
A “Reset Zoom” button will automatically appear on the new display. When you are finished with your studies, simply click the same icon to restore the original time-period setting.
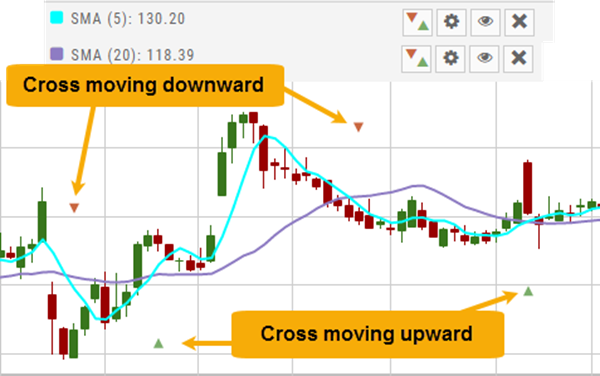
Crossover Arrows
The Crossover Arrows ![]() identify the crossover points on indicators.
identify the crossover points on indicators.
For upper indicators, you can select 2 indicators and the chart will show the crossover arrow.
Example: If you select the 5 day and 20 day SMA the Green arrows will show the 5/20 crossover points when in an upward movement, Red for downward.
Only 2 moving averages can be selected at a time when utilizing this tool. If you wish to make a change to another moving average indicator, one must first be deselected before adding the new indicator.
indication
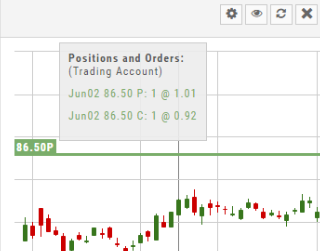
Working Orders Displayed on Chart
Charts display working orders and existing positions of selected brokerage accounts, currently Choice Trade and TD Ameritrade. More brokerages will be forthcoming.
- Stocks show a horizontal line at the entry price.
- Options show a horizontal line at the strike price.
- Green for Long and Red for Short.
The group of 4 icons, located above the Working Order, allow you to Edit (Gear), Hide(Eye) Refresh (Circle arrows) or Remove (X).
![]()
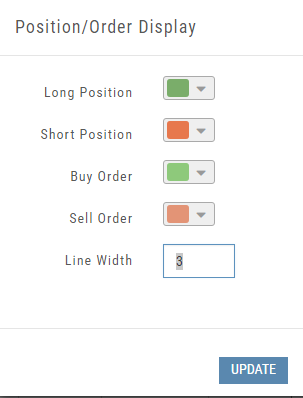
Display choices including colors and line width are available in settings by clicking the “Gear” Icon.