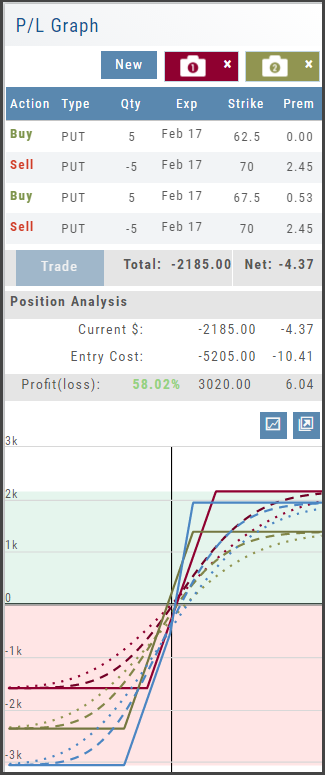
Snapshot: Comparing Positions
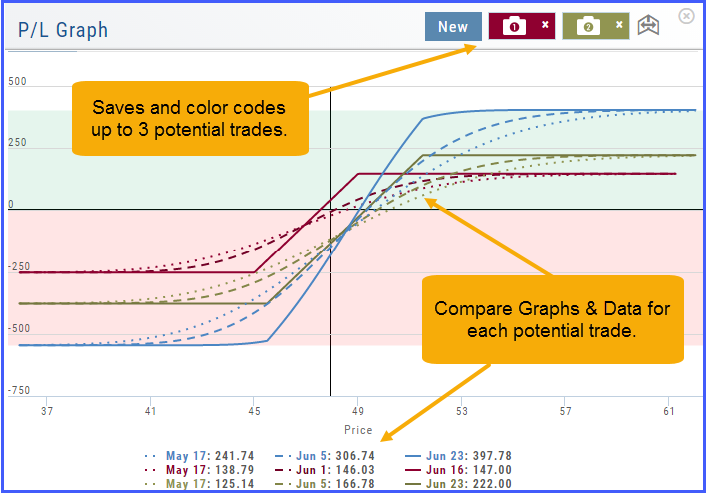
The Snapshot feature gives you the ability to compare up to three scenarios in one view without having to change screens or erase previous setups. You can even submit a trade from this part of the platform!
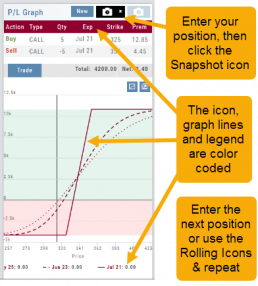
- From the Calls+Puts chain (as well as “Calls” or “Puts”) enter the initial trade position.
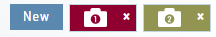
- Next click one of the camera icons:
- Repeat the first step using the Rolling Icons to adjust the initial position to a new scenario:
- Click the 2nd camera icon & repeat the above steps for the last trade comparison.
Note: The position lines are color coded to match the Snapshot (or New) icon.
Once you decide on the optimal position, click ‘Trade’ from the P&L Graph and you’ll be taken to the Order Ticket of your brokerage account with the option information auto-filled. 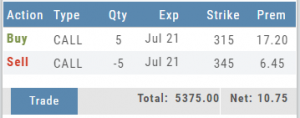
Trade Management
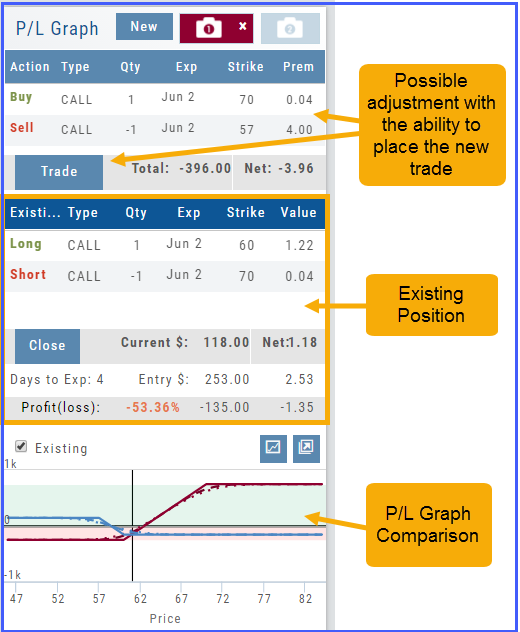
This platform makes it easy to manage and adjust trades when needed. The Snapshot feature and the P/L graph enables you to visually assess adjustments.
Once the existing trade is showing on the options page, take a ‘snapshot’. Enter the adjustment, then take another ‘snapshot’.
To submit the adjustment to the Order Ticket of your brokerage account, click “Trade”. The smart ticket system will even handle the trade adjustment automatically by entering the appropriate buy/sell, open/close combination. 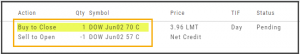
Rolling Positions
It’s easier & faster to evaluate your Trade
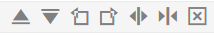
Once you have entered a position, you can easily make adjustments for further evaluation using the group of Rolling Icons in the upper-center part of the Option Table.
These icons will allow you to move the whole position: 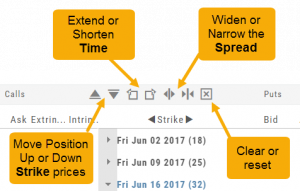
Up or Down Strike Prices
Extend or Shorten Time
Widen or Narrow the Spread
The [X] acts as a clear function. Clicking once will clear the current positions in the chain. Clicking a second time will act as “all clear”. This will clear any snapshot trades and fully reset the option chain.
Entering a Position
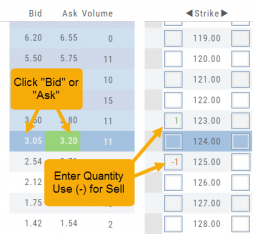
You can enter a position to analyze by clicking on ‘Ask’ for buying or ‘Bid’ for selling. You can also directly enter the quantity in the entry box. (Note: make sure to indicate a selling position with a minus (-) sign).
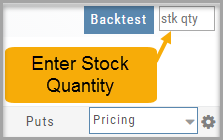
For positions that include the underlying stock, such as Covered Calls, Protective Puts & Collars, enter the stock quantity in the upper right corner of the chain window.
You can change the click quantity amount by changing the default-click parameter (found at the top of the Option Table) for 1x, 5x or 10x.
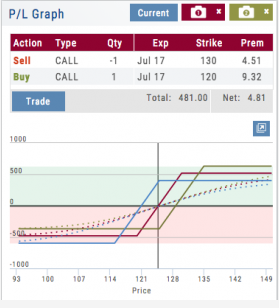
Profit/Loss Graphs
Any position entered in the Options Chain (Calls+Puts, Calls or Puts) will automatically display a profit/loss risk graph. The P/L Graph shows the Trade Profile Performance from the current day.
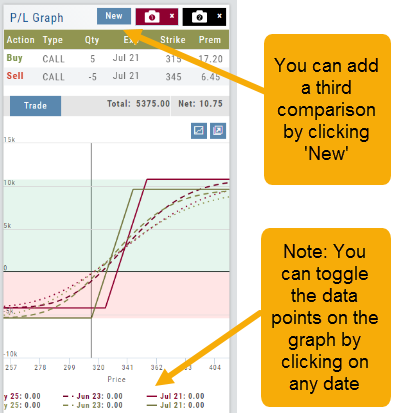
You can compare up to three (3) positions on one graph by utilizing the Camera Icons. Once you complete one trade scenario, click the first camera then click ‘New’. Structure your second trade scenario, click on the second camera. To add a third scenario, click new to structure an additional trade. The graphs will overlay.
Use SNAP to Backtest Positions
The Snapshot feature is also available with Backtesting.
- Click ‘Backtest’ on the Option Table
- Set up position
- Click one of the camera icons:
- Repeat the first step using the Rolling Icons to adjust the initial position to a new scenario:
- Click the 2nd camera icon & repeat the above steps for the last comparison.
- Select the ‘Analyze Date’ using the Date Picker (Calendar) or “EXP” to analyze the position on Expiration Date.

Trading from Options Page & Strategy Templates
Structure and analyze any options position. When ready, click “Trade” to create and submit an Order Ticket.
Comparing trades with Snap? ![]()
Simply choose the structure you want then select “Trade” to send it to the Order Ticket.
Trading multi-leg positions is easier than ever!
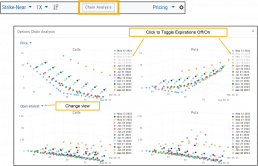
Options Chain Analysis
The Option Chain pages offers a 3-D analysis comparing expiration dates by selected criteria.
Click on “Chain Analysis” to display the graph.
Use the drop-down boxes to view the tables by Implied Volatility, Volume, Open Interest, Price, Extrinsic Value, Delta or Intrinsic Value.
Toggle the view by using the clickable legend to select the Expiration Dates to view.