Platform Features Release: July 2023
Announcing the latest Release of feature and functionality enhancements to the trading platform with the goal of improving the investment/trading decision process. These two areas of the platform have undergone a major redesign and expansion of metrics.
Key Ratio Tab(formerly Valuation)- Reworked and expanded data points offered as well as provided context of how well a stock is performing compared to its Industry and the S&P.
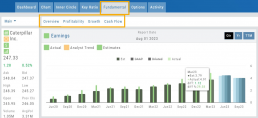
Fundamental Tab – Improved display of the expanded data available offer the ability to view fundamental metrics by Quarter, Year or Trailing Twelve Months (TTM) with the ability to adjust the time period and data display views.
Register for Office Hours, Wednesday, July 12th
Join us for a special Office Hours session, Wednesday, July 12th at 4:15 Eastern (15 minutes after Market Close)
Rance will be showcasing the Key Ratio and Fundamental tab data – how to read, understand and utilize the metrics provided.
Register using the button below. A confirmation email will be sent with a link to join for the scheduled time.
Key Ratio Tab
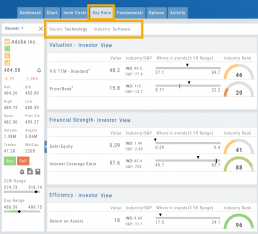
Key Ratio analysis is just one approach to evaluating stocks, and it should be complemented with other forms of analysis, such as technical analysis and market sentiment, for a well-rounded investment decision.
Key ratio indicators provide valuable information about a company’s financial health, profitability, growth prospects, operational efficiency, and overall value enabling traders to make more informed decisions:
Valuation: Helps determine whether a stock is priced attractively in relation to its earnings, sales, or book value.
Profitability: Signifies a company’s ability to generate returns for its shareholders.
Financial Strength: Assesses the ability to meet financial obligations and weather economic downturns.
Growth: Analyzes potential for expansion and increased earnings over time.
Efficiency: Measures how effectively a company utilizes its resources to generate output.
Cash Flow: Provides insights into the company’s ability to generate and manage cash.
Fundamental Tab
Fundamental Analysis involves a comprehensive examination of a stock’s financial health and its underlying value, as well as other relevant financial and non-financial metrics, to form an overall view of a company’s financial health and value.
This information is displayed in charts and graphs making it more useful in the analysis process.
It’s important to note that fundamental analysis is just one approach to evaluating stocks, and it should be complemented with other forms of analysis, such as technical analysis and market sentiment, for a well-rounded investment decision.
Enhancements
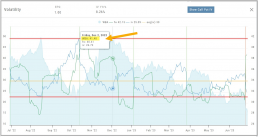
Price has been added to the Volatility Chart on the Option Chain display. Slide your cursor along the chart to display the Date, Price, HV & IV
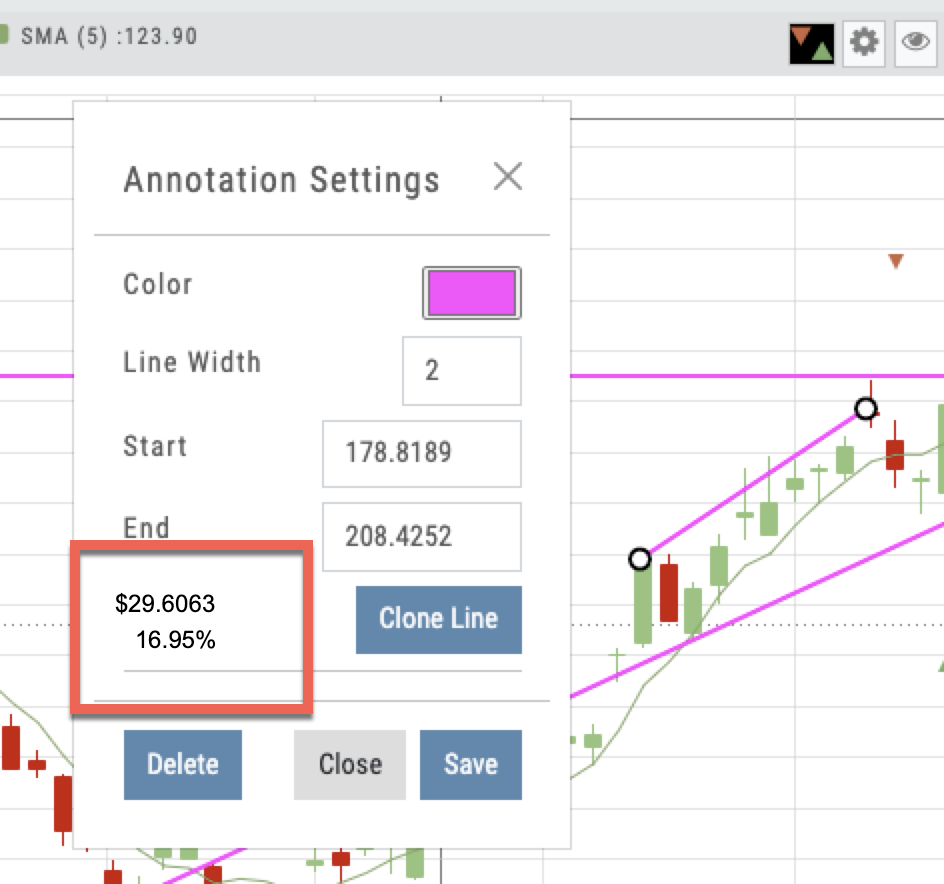
Dollar and Percentage Move added to Line Settings:
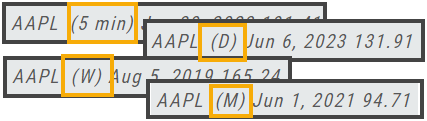
Timeframe displayed on chart when not on “Favorite”:
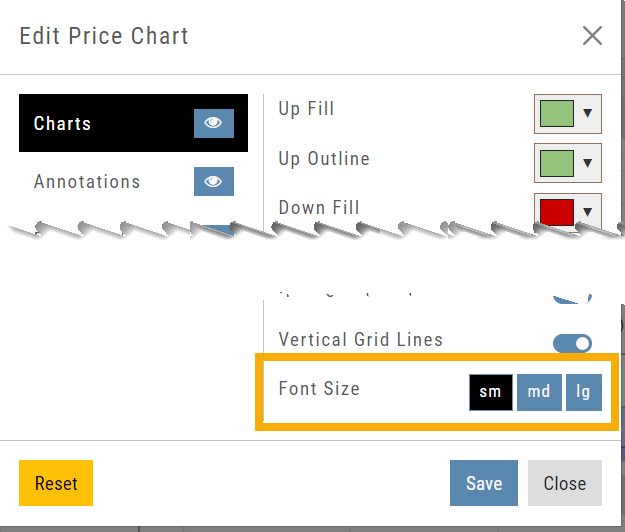
Font Size Selector for Price Chart
Vega added to Strategy Templates. Click the ‘expand’ icon, if needed:

Change Log
- Linear Regression Channel period number updating
- Roll-out time icon synced with Risk Graph
- Added “No or Limited Dividend Information” message
- Corrected Backtest Net Debit/Net Credit responsiveness
- Reset button function restored on Projected Price
Heat Map & Spectrum Overview
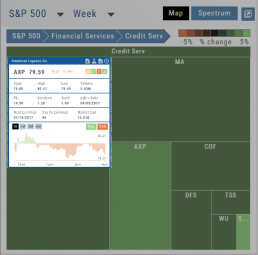
For Example: Clicking on “Financial Services” industry portion on the map of the S&P 500, then “Credit Services” will yield another map of 8 companies: Visa, Mastercard, American Express, etc. Clicking on any of those boxes will display the Stock info at a glance. Notice the Navigation Icons such at The Score as well as those to add to a Watchlist or send to Research.
The “Spectrum” View maps the sectors within the Index, with the number of companies in (parenthesis) by the performance by the time-frame selected. You can drill-down by selecting the sector group, then industry and company.
Note: By selecting the “Go Big” Icon, ![]() , in the upper-right corner of the corner of the panel, expands the amount of information and navigational icons.
, in the upper-right corner of the corner of the panel, expands the amount of information and navigational icons.
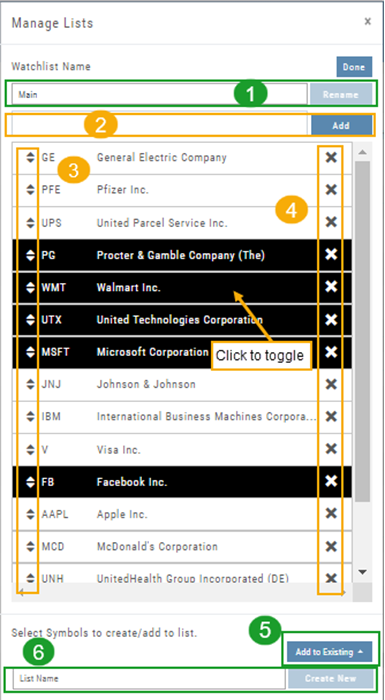
Manage/Modify Watchlists
The Modify feature offers the following Symbol and List Management capabilities in one location:
- Rename the current Watchlist
- Add Symbols to the current Watchlist
- Use up/down arrows to drag/rearrange symbols in selected List
- Remove symbol(s) by clicking on ‘X’
- Highlight symbol(s) to add to another Existing Watchlist
- Highlight symbol(s) to Create a New Watchlist
Bonus! You can keep your Watchlist sorted by any heading using this feature:
Select your Watchlist
Sort by any Heading (Example: Price – High to Low)
Click on the Manage Icon, then click “Done” at the top of the screen
This setting will be ‘sticky’ until you change it.