You can add/remove and even extend Time Periods
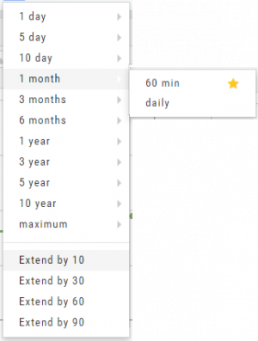
Use the plus (+) to select the length and periodicity to display. Intervals range from minute-by-minute for a 1 Day Chart to month-by-month for up to 25 years (Maximum)
![]()
Click the ![]() on any time period to add it to the header for easy access to frequently used selections.
on any time period to add it to the header for easy access to frequently used selections.
You may remove any favorite period by either clicking the “X” in the upper right of the button in the header or simply clicking the star again in the selector menu.
Finally, Extend the Chart by 10, 30, 60 even 90 periods beyond today to evaluate Chart Patterns. If you select “Extend By 30” on a daily chart, it will extend by 30 days. On a weekly chart, it will extend by 30 weeks. (Note: This feature is applicable to Daily, Weekly and Monthly charts).
Trend lines can be drawn through the extended period.
This feature can be toggled on/off by the same (+) in the header.