Fundamentals Tab
Fundamentals
Fundamentals provide valuable insights into the financial health and performance of a company. They offer a comprehensive analysis of the company’s operations, profitability, growth potential, and overall stability.
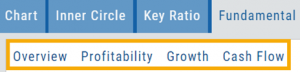
Fundamentals are comprised of Earnings, Dividends, Price Projections, Profitability, Growth, and Cash Flow.
Profitability, Growth, and Cash Flow offer even more detail. Either click the button in that section:
![]()
OR click the appropriate category at the top of the window:
Earnings data provide insight into a company’s financial health and performance.
Past earnings reports offer insight into the company’s historical growth, profitability, and stability. Positive earnings trends may indicate a well-performing company. Negative or declining earnings could be cause for concern.
Earnings
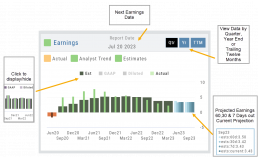
Earnings projections provide forecasts of a company’s future earnings to gauge Market sentiment and investor expectations. Projections are compiled by financial analysts using factors such as industry trends, company guidance, and economic conditions. Surpassing or falling short of projections can greatly impact stock price.
Some benefits to both the company and shareholders include:
Income Generation
Shareholder Loyalty
Return on Investment
Dividend Reinvestment
Signal of Financial Health
Possible Tax Advantages
Disciplined Capital Allocation
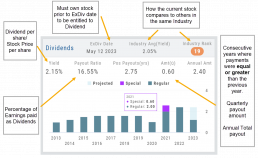
Dividends
The decision to pay dividends is up to the company’s management and board of directors, who weigh various factors, including the company’s financial position, growth prospects, and other capital allocation priorities. Dividend payouts are not guaranteed and may fluctuate or be suspended based on the company’s circumstances and strategic considerations.
Price Projection
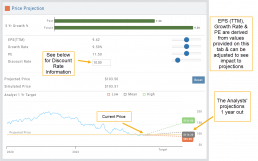
Discount Rate
Determining the appropriate discount rate for a stock is a subjective process and depends on various factors.
Here is an example:
- Risk-Free Rate: Start by considering the risk-free rate, (the theoretical rate of return on a risk-free investment such as government bonds). This serves as a baseline for the discount rate. An online search can locate this information for you.
- Risk Premium: Assess the risk associated with the specific stock you are evaluating. Stocks are inherently riskier than risk-free investments, so you need to add a risk premium to the risk-free rate. The risk premium accounts for the additional return expected by investors for taking on the extra risk. The risk premium can vary depending on factors such as industry, company-specific risks, economic conditions, and market volatility.
- Beta: This measures its sensitivity to market movements.
Beta of 1 = the stock moves in line with the overall market
Beta > 1 = the stock has higher volatility and would warrant a higher discount rate to reflect the increased risk. - Company-Specific Factors: Are there unique company factors (financial health, competitive position, growth prospects, management quality, etc) that could positively or negatively influence the discount rate?
- Sensitivity Analysis: Changing the discount allows you to assess the impact of the stock’s valuation. Some sectors are subject to more volatility than others: the Energy and Material Sectors tend to be more volatile than Consumer Staples or Utility Sectors.
The discount rate is subjective. Different investors might have different views on what the appropriate discount rate is for a given stock, based on their own risk tolerance, the specific risks associated with the company, and their expectations for future market conditions.
Profitability
Revenue: Money generated from sales of goods or services. It is income earned prior to deducting expenses or costs
Cost of Revenue: Expenses directly related to production, manufacturing, or acquisition of products/services sold. Typical examples include raw materials, labor, overhead, etc.
Operating Expenses: Day-to-day, necessary operating expenses not directly related to the production/acquisition of goods/services. Examples: Wages, utilities, depreciation, advertising, etc.
Other Expenses: Depending on the nature of the business can include: Taxes, Interest, Non-operating losses, Restructuring, Non-recurring, etc.
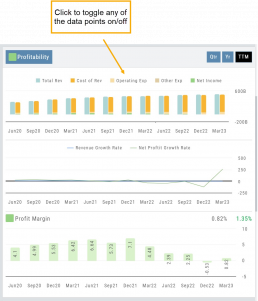
Revenue Growth Rate: Percentage change (+/-) in a company’s sales/revenue over a period of time:
Revenue Current–Revenue Previous/Revenue Previous x 100
Net Profit Growth Rate: Percentage change (+/-) in a company’s net profit over a specific period of time:
Net Profit Current–Net Profit Previous/Net Profit Previous x 100
Profit Margin: Percentage of revenue a company retains after deducting all expenses.
A higher profit margin indicates a company is generating more profit relative to its revenue. A lower percentage suggests higher expenses in proportion to revenue.
Growth
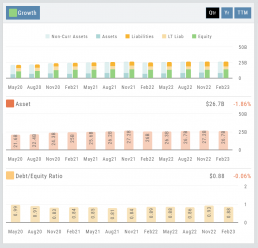
Asset: These can vary by industry/company. Common examples that contribute to a company’s growth are Financial, Intellectual Property, Human Capital, Physical Assets, Technology/Info Systems, Customer Base, Brand Equity, Partnerships, and Networks.
Debt/Equity Ratio: Total Debt divided by Total Equity. Interpretation varies by industry and a company’s specific circumstances: a high ratio can indicate higher financial risk OR effective management of debt through cash flow. A low ratio can indicate a conservative financial position OR under-utilization of debt and missed opportunities for growth.
Non-Current Assets: Resources not intended to be converted into cash or used up within a year.
Assets: Anything of value that has the potential to generate future economic benefits.
Liabilities: Obligation or debt a company owes to external parties that must be fulfilled in the near future.
Long-term Liabilities: Obligation or debt a company owes but has more than a year to repay.
Equity: The portion of a company’s value belonging to its owners or shareholders after all debts and obligations have been settled
Operating Cash Flow: Represents the cash inflow/outflow directly related to day-to-day activities including sales of goods and services, paying operating expenses, and collection of receivables.
Free Cash Flow: Cash flow available for discretionary use after accounting for operating expenses, capital expenditures, and changes in working capital. Positive values offer opportunities, negative values may indicate financial challenges.
Cash Flow
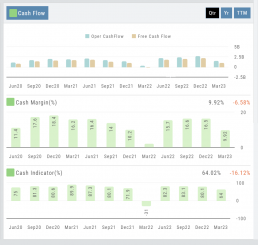
Cash Margin %: Percentage of cash generated from a company’s sales revenue after deducting its cash operating expenses. It measures the profitability and efficiency of a company’s operations to generate cash.
Cash Indicator: The industry percentile ranking of a company’s ability to generate cash from its operations.
Position Notifications
When you Enable and Activate Account Notifications, you’ll receive emails on upcoming activity that may affect your existing positions.
- Upcoming Earnings – Monday Morning via Email
- Upcoming Dividends – Monday Morning via Email
- Option Position Expiring – Two days prior via Email
To begin, locate and click on the Envelope Icon at the top of the platform page, next to your Username:
![]()
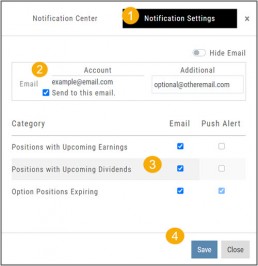
Follow the steps as outlined and illustrated:
- Click on Notification Settings
- Add your email (Optional: Add 2nd email)
- Check/uncheck Categories
- Click “Save”
The settings can be updated at anytime by following the above steps.
Next:
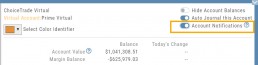
For each account you want to receive notifications on, toggle the switch located on the Account Summary tab to the “On” position as shown in the graphic.
**Without this step, you won’t receive the notifications.**
Expiration Notifications will be emailed 2 days in advance.
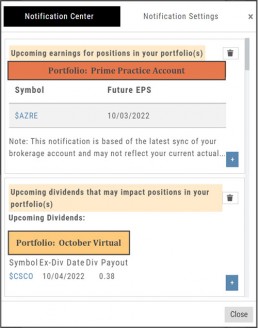
Each Monday, prior to Market Open, an email will be sent where there’s an Earnings or Dividend for any of the positions in the account(s) you have activated.
The Notification Center will list what has been emailed to you for each account you have activated.
The Account Name and associated Color Tag will be displayed on each Notification and allows for quick identification.
Platform Features Release: December 2022
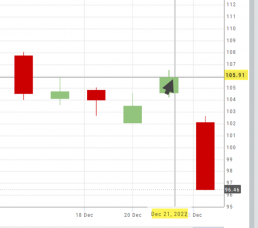
Announcing the latest Release which added a powerful Lower Indicator on the Charts Tab: 52 Week Hi/Lo. Price/Date info has been added to X/Y axis
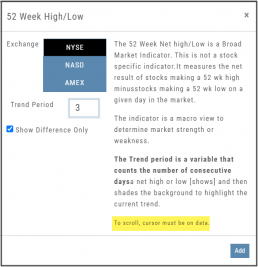
52-Week Hi/Low Indicator
The newest lower indicator: 52-week Hi/Low Indicator is a Broad Market Indicator. It is not Stock specific.
View how individual Stocks/ETFs are faring compared to the Broad Market.
Select from NYSE, NASD or AmEx
There are two views:
Show Difference Only – Display either a green or red (or no) bar representing the net advancers/decliners for that period.
Show High & Low (uncheck box)– Displays both green/red bars to illustrate number with new 52 week high/lows.
The background color identifies a bullish or bearish trend, based upon the number of days selected (Trend Period)
Example: If 3 days are selected, background highlight will begin on the 4th consecutive day of gains (or losses).
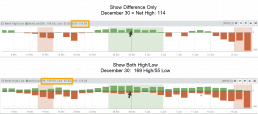
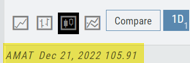
X/Y axis – Price/Date display
The cursor’s crosshairs will display the Price/Date info along the X/Y axis for easier reading.
This information will still appear in the upper/right corner above the chart:
Drawing Key Activation
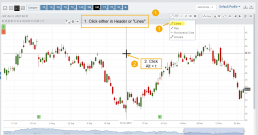
Use your keypad to activate drawing lines on the Chart by following these steps:
1. Click either in Header area above the chart – OR –
Click the Annotation icon>Line
2. Click on chart, then “Alt” and “T” keys where you want to start line.
Once activated from either of the starting points (1), the function works on the current chart, without having to reactivate by clicking on the Header or Annotation icon.
Platform Features Release: November 2022
Announcing the latest Release allowing for customized Watchlist views. Improvements in Journal functionality will increase responsiveness and allow users to better control the data displayed. Format enhancements were also made to increase readability
Watchlist Views – Create, Save & Edit
The ability to create your own Watchlist views based on criteria important to you enhances the work flow of finding the best candidates for trading.
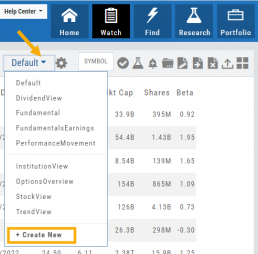
Click on ![]() next to the (Default) Watchlist, then select “Add New” to get started.
next to the (Default) Watchlist, then select “Add New” to get started.
Build your own views from over 160 data points, then adjust the display position in the order you want them to appear.
Click on ![]() icon to edit a view you previously created.
icon to edit a view you previously created.
Learn more by clicking below:
Improvements
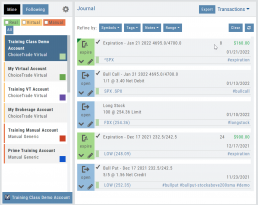
The Journal default displays Order/Trade activity from the Activated Trade Account.
To switch or add accounts, simply click on the other Account tabs or select by group: Real, Virtual, Manual or All accounts.

The improved functionality allows for faster journal activity display and easier trade analysis.
Change Log
- Resolved Score Icon Navigation from Home/Market Tab
- Corrected Fundamental/Dividend missing data
- Moving Average indicator functionality restored on Custom Page
- Corrected display data on Fundamental Tab
- Addressed candlestick not appearing first 20 minutes on Mondays.
- Rectified downloading data from Screener