Multiple Position Analysis
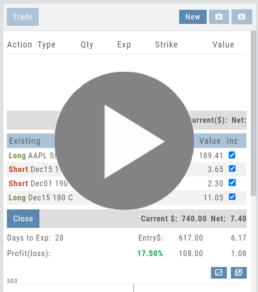
We often have more than one position on a particular Stock/ETF, so how can each position, or leg be evaluated?

Click the Graphic Below for video on the Option Tab P/L Feature to see how to evaluate individual legs or positions on a Stock/ETF
Option Chain Video
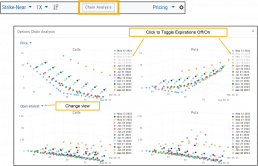
Options Chain Analysis
The Option Chain pages offers a 3-D analysis comparing expiration dates by selected criteria.
Click on “Chain Analysis” to display the graph.
Use the drop-down boxes to view the tables by Implied Volatility, Volume, Open Interest, Price, Extrinsic Value, Delta or Intrinsic Value.
Toggle the view by using the clickable legend to select the Expiration Dates to view.