Create Watchlists
The Market & Watch Tab Icon ToolBar allows you to Create/Modify/Manage your Lists.
Hover your cursor over the icon to view it’s ‘task’: 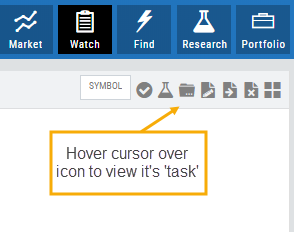
Select Candidates
Send to Research
Create/Delete a List
Modify an existing List
Send candidates from one List to another
Remove candidates from existing List
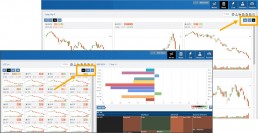
Change View: List or Tile
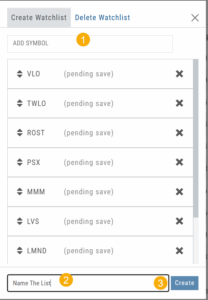
To Create a New Watchlist:
1. Under ‘Create Watchlist’, enter symbols to automatically add
2. Enter the name of New Watchlist
3. Click “Create”
Other ways to Create Lists include:
Research>Chart>”Recents” list.
From the Find Tab>Scans and Find Tab>Calendar.
Selecting candidates from Scans (Ex: Bullish Ascending Triangle ) or Calendar for an Earnings or Dividend date to get the list of stocks that fit your selected criteria, click the “Check” icon to the stock symbols you want to keep, then click the Folder + icon to , name your new Watch List then click “OK”.
You can also copy/paste up to 100 symbols from an outside source to a newly created (or existing list) provided the following apply:
The symbols are separated by:
A Space: TSLA ZM GOOG NFLX
Or by a Comma: TSLA,ZM,GOOG,NFLX
Or a Return:
TSLA
ZM
GOOG
NFLX
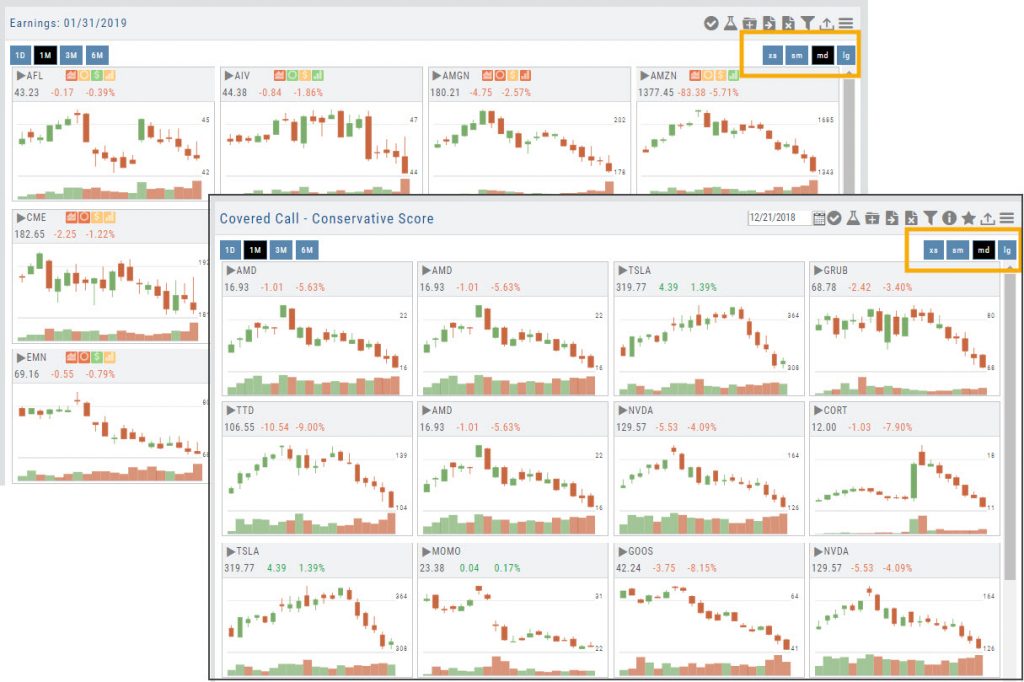
Tile View Sizes
Tile View is available in 3 sizes on the Market or Watch Tabs.
Scans and Earnings/Dividends Calendar under the Find tab offer 4 Tile View sizes: Extra Small to Large.
The platform’s adaptive and responsive technology will automatically adjust the number of tiles shown based upon the available space as well as allow continual scrolling for large lists.
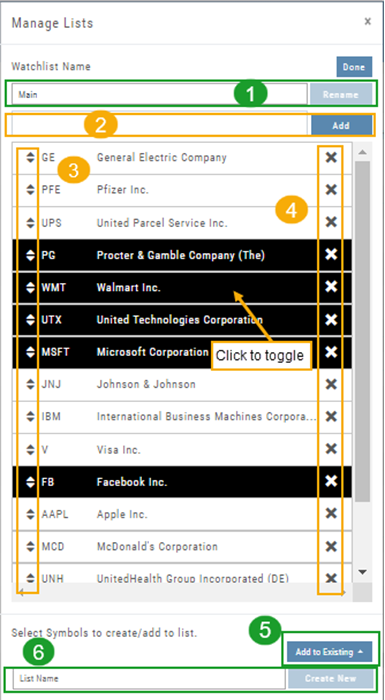
Manage/Modify Watchlists
The Modify feature offers the following Symbol and List Management capabilities in one location:
- Rename the current Watchlist
- Add Symbols to the current Watchlist
- Use up/down arrows to drag/rearrange symbols in selected List
- Remove symbol(s) by clicking on ‘X’
- Highlight symbol(s) to add to another Existing Watchlist
- Highlight symbol(s) to Create a New Watchlist
Bonus! You can keep your Watchlist sorted by any heading using this feature:
Select your Watchlist
Sort by any Heading (Example: Price – High to Low)
Click on the Manage Icon, then click “Done” at the top of the screen
This setting will be ‘sticky’ until you change it.
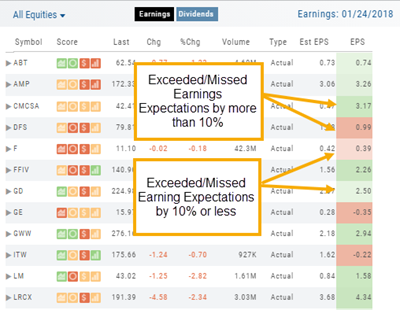
Earnings Per Share Performance
Once a date has past and earnings have been announced, Earning Per Share (EPS) is color-coded based on how much the company beat (or missed) Expectations.
Go to Find>Calendar, select “Earnings” and view any past date, where earning have been announce, to view the results.
Dark Green/Dark Red is considered surprise, and indicate the company beat/missed estimates by more than 10%
Light Green/Light Red indicate the company beat/missed estimates by 10% or less