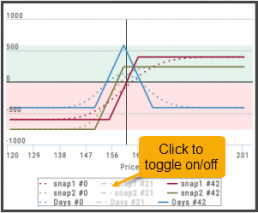
Clickable Legends
When comparing trades using the Snapshot feature, the P/L Graph can get a little crowded. You can clear some of the lines by simply clicking on the legend to toggle visibility.
Clickable legends are also available in other graphs and charts within the platform.
Go Big - Graphs & Charts
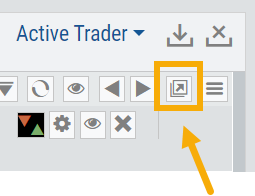
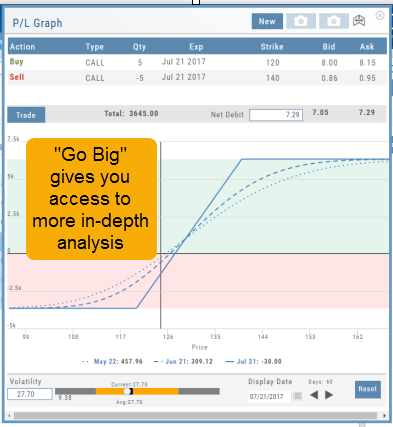
Anywhere you see the ‘Go Big’ icon ![]() , you can expand the graphic and access additional information.
, you can expand the graphic and access additional information.
The Chart Tab under Research has such a button in the icon toolbar as shown:
The Heat Map on the Market Tab will allow you to filter criteria such as stock price, volume, market cap, etc. 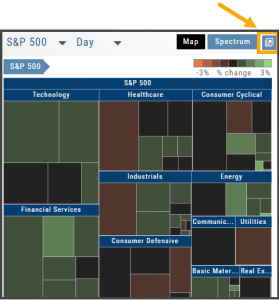
In the Options Tab, you can do this with the P/L Graph and the Volatility Chart. The icon is located at or near the upper right of the graph or chart.
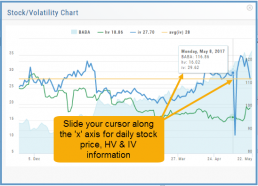
Expanding the Stock/Volatility Chart allows you to view past Historic Volatility, Intrinsic Volatility and stock price on a day-to-day basis.
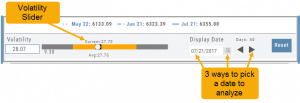
For deeper Trade Analysis, use the Volatility Slider tool and the Date Picker, located at the bottom of the P&L Graph:
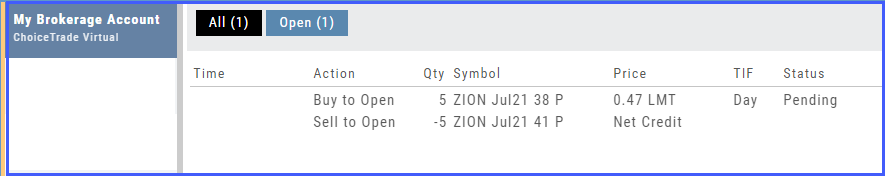
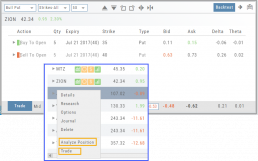
From Strategize to Analyze to Trade
Any strategy-specific options trade will have ‘Analyze’ and ‘Trade’ in the Action Icon.
Click ‘Analyze’ to see the trade in the options chain. From there, you can edit or click ‘Trade’ to have the trade sent to the Order Ticket of your brokerage account.
Give it a try!