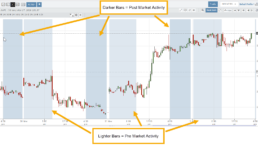
Intraday Charts displaying Pre/Post Market Activity
Intraday extended-hours charting enables users to visualize price movement beyond standard market hours, providing a more complete picture of how news, earnings, and overnight activity impact their setups. This helps reinforce timing, entries, and the real-world behavior of the markets.
Extended Trading Hours
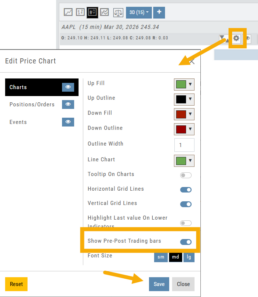
Pre and Post-Market activity can be displayed on Intra-Day charts:
First, click on the Gear icon as shown.
Then, toggle “Show Pre-Post Trading bars” to the On position, as shown.
Finally, “Save”.
26-03 Release Notes: Journal Auto-Reconcile, Extended Trading, New Charting Indicators
Platform Release Summary
This release helps you see more of the market, spend less time tracking trades, and apply your strategies with greater confidence—with extended-hours charting, automated journal reconciliation, and new technical indicators.
Journal Auto-Reconcile
The auto-reconciliation in the Trade Journal aligns trades and results—allowing users to focus on analyzing performance instead of managing data. Since consistent review is key to improving as a trader, this feature makes the process significantly easier and more accurate
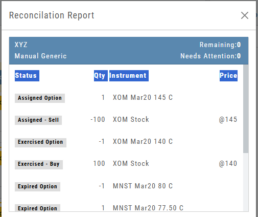
Start in the Reconcile View of the Journal:
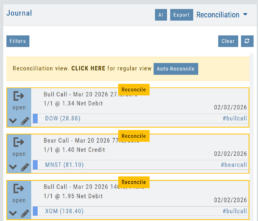
Next, click the ![]() button.
button.
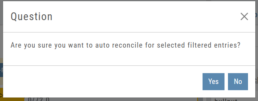
The dialog box to the left will appear:
Click “Yes”
The display will list the resulting action for each expiration.
You can scroll to review.
Click the “x” in the upper right corner to automatically update
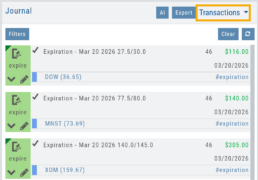
The Reconcile view will clear and all Journal Tabs will update to reflect the action resulting from each Expiration.
Extended Trading Hours
Pre and Post-Market activity can be displayed on Intra-Day charts:
First, click on the Gear icon as shown.
Then, toggle “Show Pre-Post Trading bars” to the On position, as shown.
Finally, “Save“.
Additions: New Charting Indicators
Chande Momentum Indicator (CMO)
Measures the strength of price movement by evaluating both gains and losses, providing a more balanced view than traditional oscillators.
- Above +50: Indicates overbought conditions (potential selling opportunity)
- Below -50: Indicates oversold conditions (potential buying opportunity)
Summary: Helps identify when price movement may be overextended and due for a reversal.
Chaikin Money Flow (CMF)
An oscillator measuring buying and selling pressure by analyzing money flow volume over a set period, rather than cumulatively.
- Positive values: Indicate buying pressure (accumulation)
- Negative values: Indicate selling pressure (distribution)
- Default setting: 20-period (typically 20 days)
Summary: Helps identify whether money is flowing into or out of a security over a defined timeframe.
Directional Movement Index (DMI)
A trend indicator that measures both the direction and strength of a trend using three lines: ADX, +DI, and -DI.
- +DI above -DI: Indicates an uptrend
- -DI above +DI: Indicates a downtrend
- ADX: Measures trend strength (regardless of direction)
- Default setting: 14-period
Summary: Helps identify trend direction and the trend’s strength
Ultimate Oscillator
A momentum indicator that combines three timeframes to provide a more balanced view of market strength and reduce false signals.
- Higher values: Indicate stronger buying pressure
- Lower values: Indicate stronger selling pressure
- Used to identify overbought/oversold conditions and potential trend reversals
Summary: Helps confirm momentum and spot potential turning points with greater reliability.
Change Log
- Improve OHLC appearance
- Repair drawing annotations on extended chart
- Reconciliation mode functionality fixed