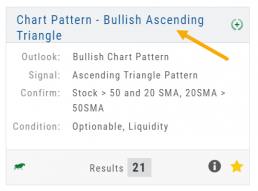
The Tile
The Scan Name and number of results are displayed on each Tile. Click on the ![]() on the upper right corner of the screen to display Scan Criteria.
on the upper right corner of the screen to display Scan Criteria.
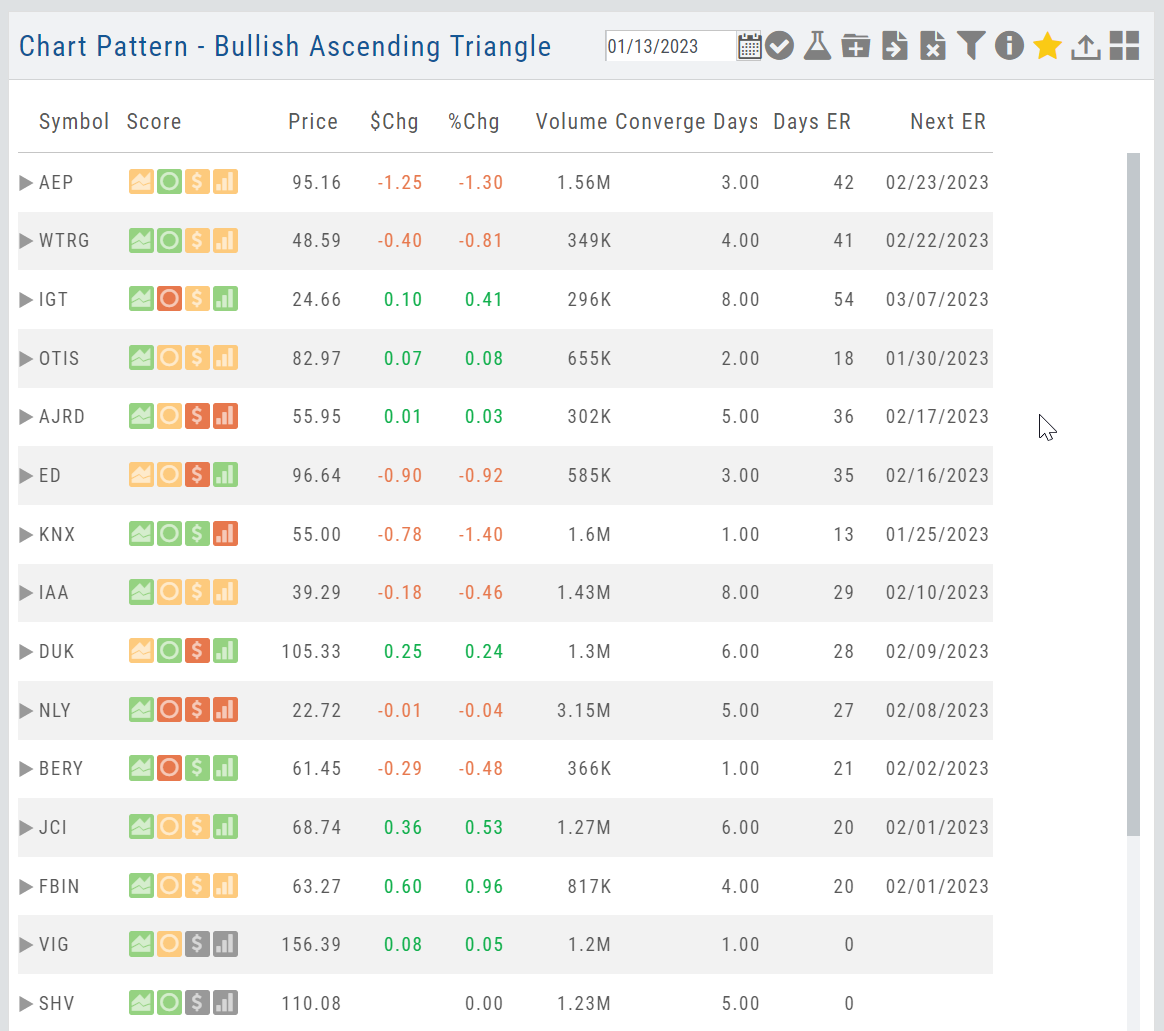
Click on the name of the Scan Header to view results.
Use the toolbar icons on the results page to Research, send to a Watchlist, Filter, etc.
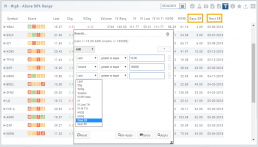
Filter Scan Icon
The Filter icon ![]() – located in the upper left area of the scan page – allows you to narrow candidates of an initial scan by applying additional parameters.
– located in the upper left area of the scan page – allows you to narrow candidates of an initial scan by applying additional parameters.
You can adjust the criteria at any time to further narrow or increase the number of results by eliminating, adding or adjusting entries.
This Smart Search feature filters data unique to the scan. Ex: Covered Calls Filtering offers Net Entry Cost, $ Return with no Movement, $ Return if Called out, etc.
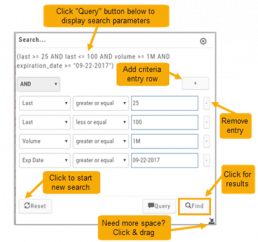
Use drop-down box to select parameters and enter criteria in boxes.
Add rows if needed by clicking on ‘+’
If you need more space, click and drag the arrow in the bottom, right corner.
Click “Find”.
Click ‘Reset’ to start over. The “Query” button displays the criteria at the top of the Filter page. Click again to remove.
Give it a try!
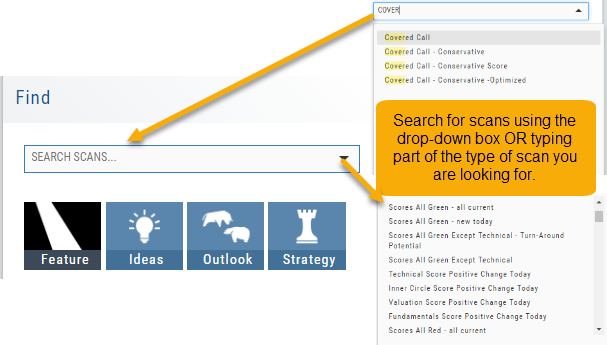
Scan - Smart search
The search box is found at the top of Find. It performs ‘smart searches’ by pulling all scans related to what is typed in. If you don’t know the name of the specific scan, but know it is related to Earning announcements, type “earning” and a list will populate showing scans that are about Earning. Typing “Bull” or “Bear” will bring up scans with “Bull or Bullish” or “Bear or Bearish” in their names, respectively.
Of course, you can also elect to search by clicking the arrow for a complete list of available scans in a drop-down search.
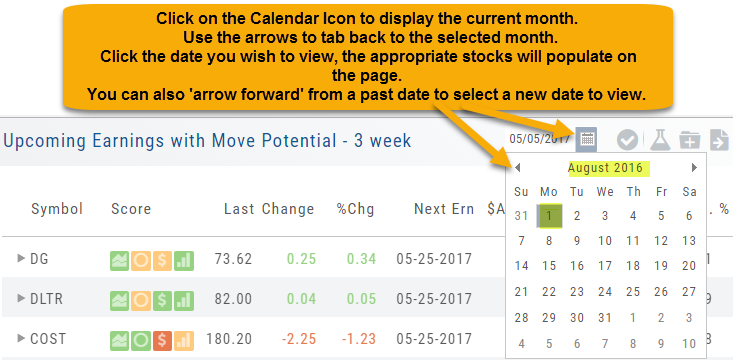
Past Scan Results
When viewing scan results, you can select a past date by clicking on the Calendar Icon, then the back arrow until you get to the month you want to search from. Click on the date you wish to view & the appropriate stocks will populate the screen.
The date you are searching will be displayed in the header
Note: Past Scans availability dates vary. When a new scan is added, the history is available from the day it was added to the platform going forward.
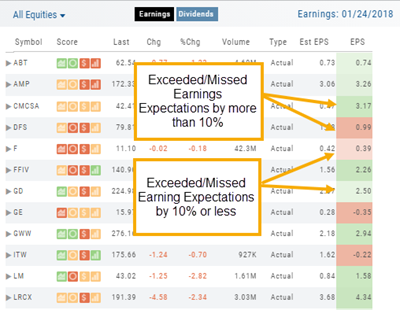
Earnings Per Share Performance
Once a date has past and earnings have been announced, Earning Per Share (EPS) is color-coded based on how much the company beat (or missed) Expectations.
Go to Find>Calendar, select “Earnings” and view any past date, where earning have been announce, to view the results.
Dark Green/Dark Red is considered surprise, and indicate the company beat/missed estimates by more than 10%
Light Green/Light Red indicate the company beat/missed estimates by 10% or less