Key Ratio (formerly Valuation)
Key Ratio
A stock’s key ratios provide valuable insights into various financial aspects of the company. They are derived from the financial statements and help investors evaluate the company’s financial health, performance, and overall investment potential.
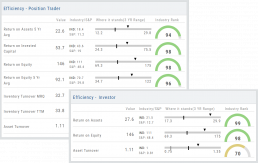
Assessing Key Ratios may vary by the type of trader one is: Growth Investors differ from Swing Traders who differ from Position Traders. The platform offers different views using Key Ratios for such scenarios.
Key Ratios allow you to not only view the company’s financial health but also view them in relation to others in the same industry, comparing ‘apples to apples’. Having this information allows you to better evaluate potential opportunities.
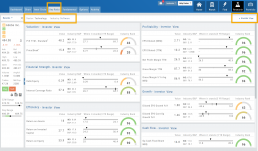
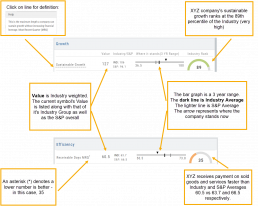
Deciphering the graphics
The illustrations show how to read the information provided as well as provide context on how the particular stock is performing to the Industry as well as the S&P.
Note: Depending on the Industry and/or S&P values, their tab(s) may not appear on the bar graph.
Select the view that matches your style of trading.
Just like trading, there is no ‘one-size-fits-all’. Those focusing on longer-term trades would not be interested in the same criteria as those who prefer shorter-term positions.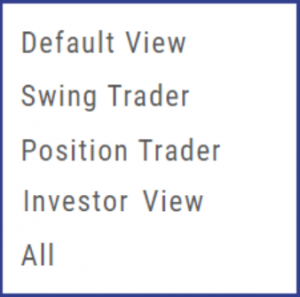
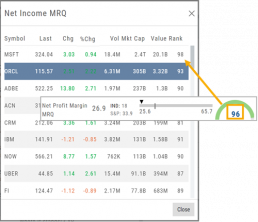
Clickable Key Ratio Value
View other industry stocks’ ranking by clicking on the numeric value as shown.
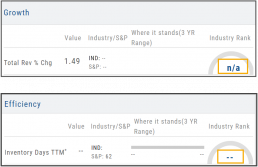
What does “N/A” or “–” indicate?
If a number does not appear in the Ratio criteria, you will see either a “N/A” or “—“
N/A indicates the datapoint is applicable, but the value not currently available
— indicates the data point does not apply, such as Inventory Ratios with Banks
Platform Features Release: April 2023
Announcing the latest feature(s)/function(s) updates, additions, or edits to the trading platform:
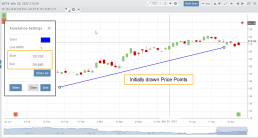
Cloning and Editing Trendlines
New Trendline Customization
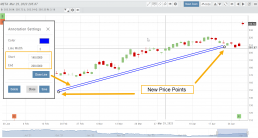
Clone trendlines with the push of a button. Easily define or edit trendline endpoints.
Click on an existing trendline to display the Annotation Settings box, make your changes, then click “Save”.
Enhancements
- Reusing canceled GTC Order preserves Duration
Change Log
- Repaired contrast on Find>Scans>Filter table
- Chart crosshair behavior resolved
- Pivot Point indicator editing restored
- Removed duplicate Inner Circle>Insider Information
- Platform Notification>“Don’t show again” fixed
- Backtest>Analyze Date selection repaired
- Corrected date display above chart
- Seasonality Chart behavior corrected
- Screener functionality repaired on several items
- Hide function on Option functionality restored
- Russell 2000 restored on Find>HeatMap
- Backend fixes on previous releases
- Net Debit/Credit responsiveness restored on Manual Accounts
Platform Features Release: March 2023
Announcing the latest features/functions updates, additions, or edits to the trading platform:
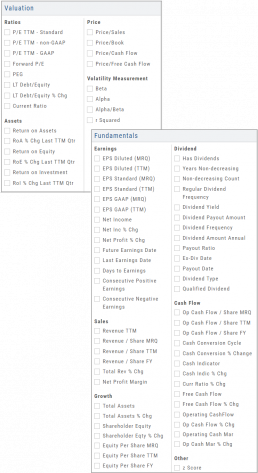
Valuation and Fundamental Data Points added
Users have more criteria to select from for both the Screener, to find potential trade candidates, and Watchlist Views to analyze candidates.
Valuation and Fundamental Data Points Added
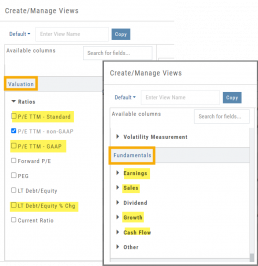
Watch List Views
Over 30 data points were added to the Valuation and Fundamental sections for Watch List Views.
Build, Save, and Edit your customized Watch List Views to your needs.
Learn how to use this feature:
Screener
Over 30 data points have been added to the Screener Function under the Valuation and Fundamental sections.
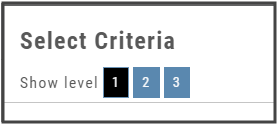
There are 3 Levels of Data Points. Level 2 has more Data Points than 1, Level 3 has all criteria available to select from.
Now users have more tools to choose customize screens. These may be saved and edited at any time.
Enhancements
- Added Average Volume line to (upper) Volume Indicator
- Saving Annotations/Texts, etc on charts are an automatic function. It no longer has to be selected.
- Scroll function added to lists on Custom, Market and Watch pages
- GAAP/non-GAAP PE/PEG (TPE and PE chart in Valuation section to reflect GAAP PE)
Change Log
- Resolved Screener Export Function
- Open/Close “save” function fixed in Backtest mode
- 2nd email saving in Notification feature setup
- Candlesticks and Volume bars line up
Create Watchlists from Spectrum View
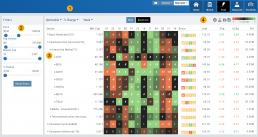
Spectrum View can be used to create or add Watchlists
1. Select the Group, Operator and Time Period
Example: Optionable, % Change, 1 Week
2. Apply Filter for Price, Volume, Market Cap and the Selected Operator
3. Click the Arrow next to the Sector to expand to Industry, repeat to display list of stocks that fits the filtered criteria.
4. Use the Icon Toolbar to multi/select symbols to either send to an existing Watchlist or Create a New List.
Use the same filters on the HeatMap View to customize your search.
The box size denotes the Market Cap size.
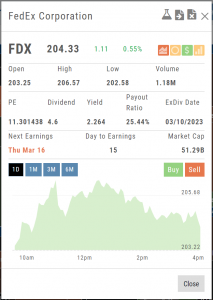
Click on the individual box to view:
Market Activity
Earning/Dividend info,
View Chart Periods
Buy/Sell stock
Send to Research
Add to an Existing Watchlist.
Platform Features Release: December 2022
Announcing the latest Release which added a powerful Lower Indicator on the Charts Tab: 52 Week Hi/Lo. Price/Date info has been added to X/Y axis
52-Week Hi/Low Indicator
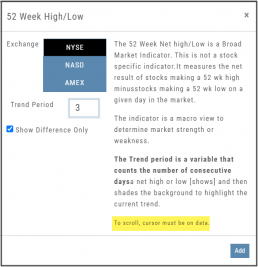
The newest lower indicator: 52-week Hi/Low Indicator is a Broad Market Indicator. It is not Stock specific.
View how individual Stocks/ETFs are faring compared to the Broad Market.
Select from NYSE, NASD or AmEx
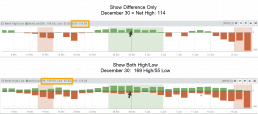
There are two views:
Show Difference Only – Display either a green or red (or no) bar representing the net advancers/decliners for that period.
Show High & Low (uncheck box)– Displays both green/red bars to illustrate number with new 52 week high/lows.
The background color identifies a bullish or bearish trend, based upon the number of days selected (Trend Period)
Example: If 3 days are selected, background highlight will begin on the 4th consecutive day of gains (or losses).
X/Y axis – Price/Date display
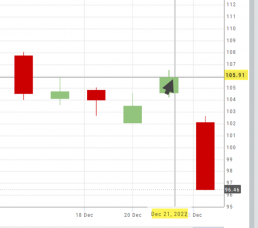
The cursor’s crosshairs will display the Price/Date info along the X/Y axis for easier reading.
This information will still appear in the upper/right corner above the chart:
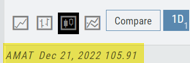
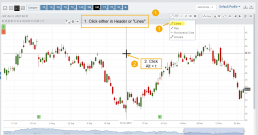
Drawing Key Activation
Use your keypad to activate drawing lines on the Chart by following these steps:
1. Click either in Header area above the chart – OR –
Click the Annotation icon>Line
2. Click on chart, then “Alt” and “T” keys where you want to start line.
Once activated from either of the starting points (1), the function works on the current chart, without having to reactivate by clicking on the Header or Annotation icon.
Platform Features Release: November 2022
Announcing the latest Release allowing for customized Watchlist views. Improvements in Journal functionality will increase responsiveness and allow users to better control the data displayed. Format enhancements were also made to increase readability
Watchlist Views – Create, Save & Edit
The ability to create your own Watchlist views based on criteria important to you enhances the work flow of finding the best candidates for trading.
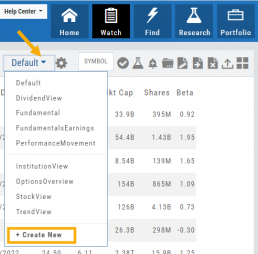
Click on ![]() next to the (Default) Watchlist, then select “Add New” to get started.
next to the (Default) Watchlist, then select “Add New” to get started.
Build your own views from over 160 data points, then adjust the display position in the order you want them to appear.
Click on ![]() icon to edit a view you previously created.
icon to edit a view you previously created.
Learn more by clicking below:
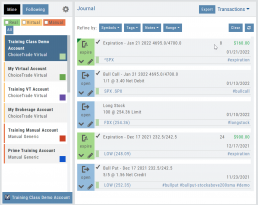
Improvements
The Journal default displays Order/Trade activity from the Activated Trade Account.
To switch or add accounts, simply click on the other Account tabs or select by group: Real, Virtual, Manual or All accounts.

The improved functionality allows for faster journal activity display and easier trade analysis.
Change Log
- Resolved Score Icon Navigation from Home/Market Tab
- Corrected Fundamental/Dividend missing data
- Moving Average indicator functionality restored on Custom Page
- Corrected display data on Fundamental Tab
- Addressed candlestick not appearing first 20 minutes on Mondays.
- Rectified downloading data from Screener