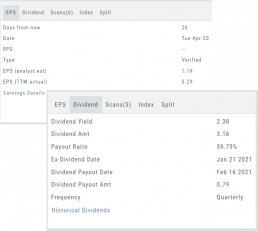
Earnings, Dividends and more...
The far right, lower box in Research provides the following:
Earnings Tab: Get Earnings date, number of business days until announcement, Estimated and Actual Trailing Twelve Months (TTM) EPS, and link to the prior 12 Quarter Earnings details.
Dividend Tab: Get Yield, Amount, Payout Ratio (dividend/EPS), the Ex-Dividend Date (deadline to complete a stock purchase to be entitled to dividends), Payout information, Frequency and link to the prior 12 Quarter Dividends.
Scans Tab: Quickly view how many & which scans the stock symbol appears on.
Index Tab: Lists the symbol and indices name(s) on which this stock appears.
Split Date: Provides most recent Split Date, Detail and a link to view Split History
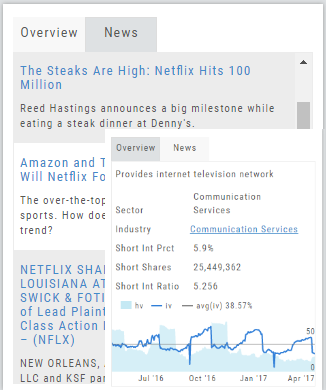
Overview & News
Located in ‘The Dashboard’, the Overview provides a snapshot of the company, including the Sector and Industry. By clicking on the Industry link, a list of stock symbols in the same category will appear. The “Stock Detail” list will have current market information and The Score navigational icons.
The News section lists articles covering, related to, or mentioning the selected Company. Click on any headline to be linked to the full article.
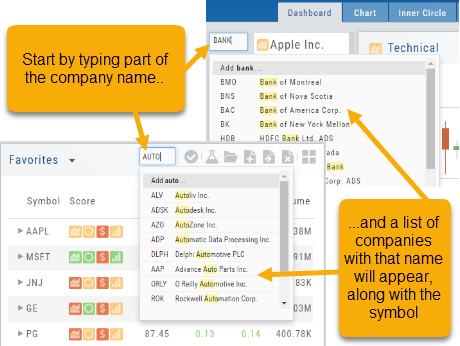
Don't Know the Symbol?
No Problem
You can search for symbols from several entry points including “Market” and “Watch”. Simply start typing all or part of the Company’s name and the system will proactively provide you with suggestions. You can use this feature anywhere including Insiders and Institutions.
For example, typing “Bank” in the Symbol box will bring up the stock symbols and names of companies with “bank” in their name.
Depending where you are in the Platform, clicking on the selected symbol while you are in:
The “Market” or “Watch” tab, it will be added to your currently open list of stocks.
The Dashboard of the “Research” Tab, it will automatically provide the top layer of information on the stock. As always, you are able to navigate to different areas or ‘drill down’.
Insider or Institutions of the “Research” Tab, the corresponding data will display, such as data by Quarter, the biggest buyers and sellers and more.
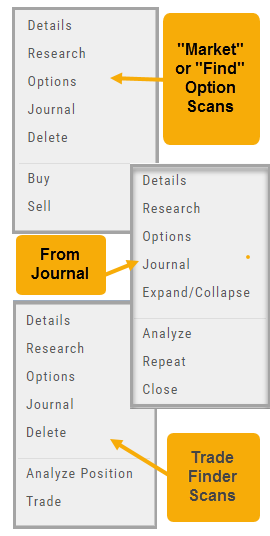
Other Navigation
Icons = Navigation
The Action (Arrow) icon will provide different actions depending on where you are in the platform. For example if you are in the Market or Find tab, ‘Detail‘ will provide a Quote Popup. ‘Research‘ will take you to the Dashboard – overview – of the stock. ‘Options‘ will take you to that part of the platform etc.
When in a “Trade Finder Scan” (identified by the ![]() icon), the Action icon choices includes: ‘Analyze Position’ which will take you to the Options tables and/or ‘Trade’ which will lead you to the Order Ticket of the Brokerage Account from the menu.
icon), the Action icon choices includes: ‘Analyze Position’ which will take you to the Options tables and/or ‘Trade’ which will lead you to the Order Ticket of the Brokerage Account from the menu.
The Action Icon is also found in the Journal. Under the “Positions” tab, clicking on the icon allows you to Expand/Collapse details of the trade, Analyze or Close the trade among other choices.