Intraday Trade Finder Scan Updates (Premium Desktop Feature)
Trade Finder Scans are updated every 30 minutes during Market Hours on the Premium Platform. That’s 12 more times than the Standard Platform version, which updates once after the Market opens.
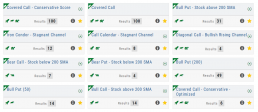
Trade Finder Scans are easily identified with a Rocket Icon in the upper left corner of the Scan box.
Scans - Find Opportunities - Overview
Stagnant? Uncertain? Bearish or Bullish? Short or long term? No problem!
This “Find” category is where to find opportunities based on current Market activity and outlook, or select opportunities based on events, such as Earnings or Dividend announcements.
Whether looking for opportunities based on The Score, Events, Chart Patterns, Bullish, Bearish, Stagnant or Unknown outlook, a scan will help you find potential trade opportunities. 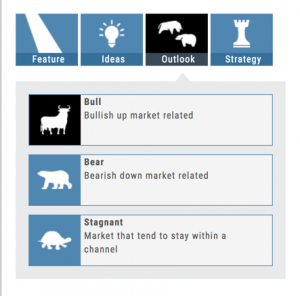
You can drill-down for scans by Category, Sub-Categories, then Group.
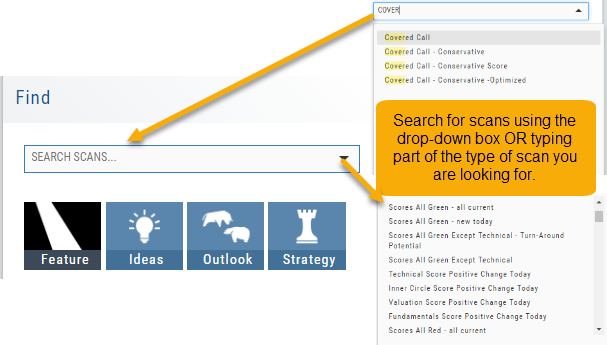
Example: Strategy>Time Spreads>Call Calendar Spreads. You can use the drop-down box, above the Category boxes to search for the scan you want or type in the box a generality about the scan. Examples: “Earning”, “Bull”, “Bearish”. “Score”, “Red”, “Green” will yield scans with that particular name in the scan
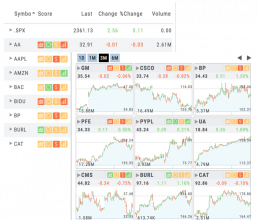
The Dashboard Scan Tab
Get the current ‘story’ on a stock.
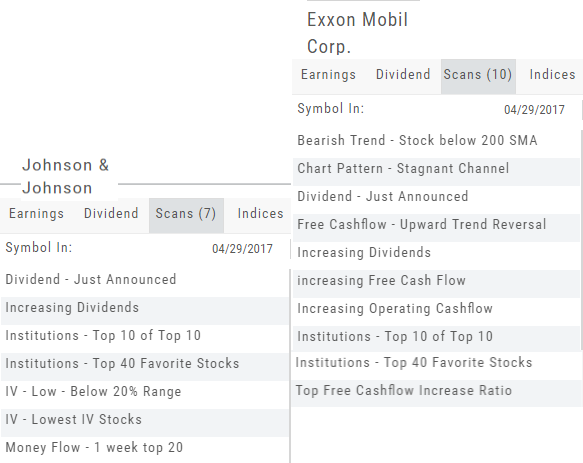
The Scan Tab is particularly interesting. In addition to providing a list of scans the stock is currently included in, it can give you a “story” about the stock. Based on the scans that the stock is showing up in, you can get an overview of outlook on the stock.
For example: JNJ shows solid longer term positive outlook.
XOM Shows stagnant with improving longer term outlook
The Top 4 Categories
The names may be different, but the scans remain the same! 
Feature – Your favorite and our highlighted scans, including scans related to The Score.
Ideas – Scans for general ideas including Dividends, Money Flow, Volatility, Earnings and more.
Outlook – For Bearish, Bullish and Stagnant outlook conditions.
Strategy – Over 20 strategy-specific scans including Bull Put, Bear Call, Iron Condor and more.
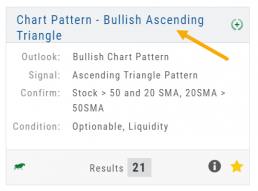
The Tile
The Scan Name and number of results are displayed on each Tile. Click on the ![]() on the upper right corner of the screen to display Scan Criteria.
on the upper right corner of the screen to display Scan Criteria.
Click on the name of the Scan Header to view results.
Use the toolbar icons on the results page to Research, send to a Watchlist, Filter, etc.
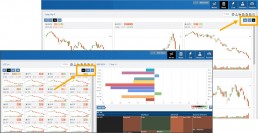
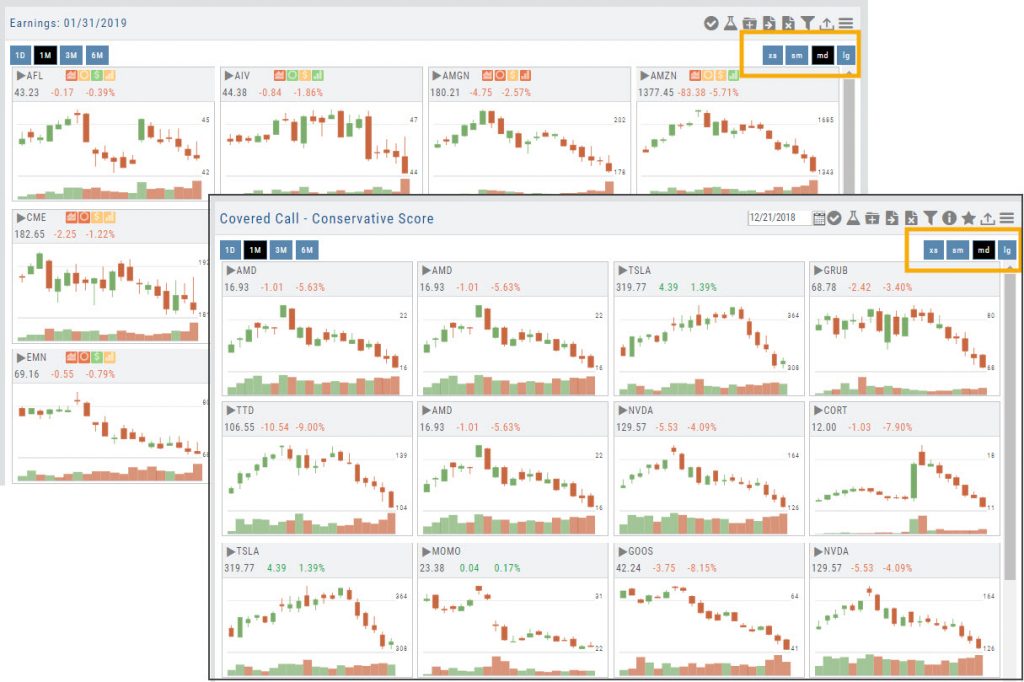
Tile View Sizes
Tile View is available in 3 sizes on the Market or Watch Tabs.
Scans and Earnings/Dividends Calendar under the Find tab offer 4 Tile View sizes: Extra Small to Large.
The platform’s adaptive and responsive technology will automatically adjust the number of tiles shown based upon the available space as well as allow continual scrolling for large lists.
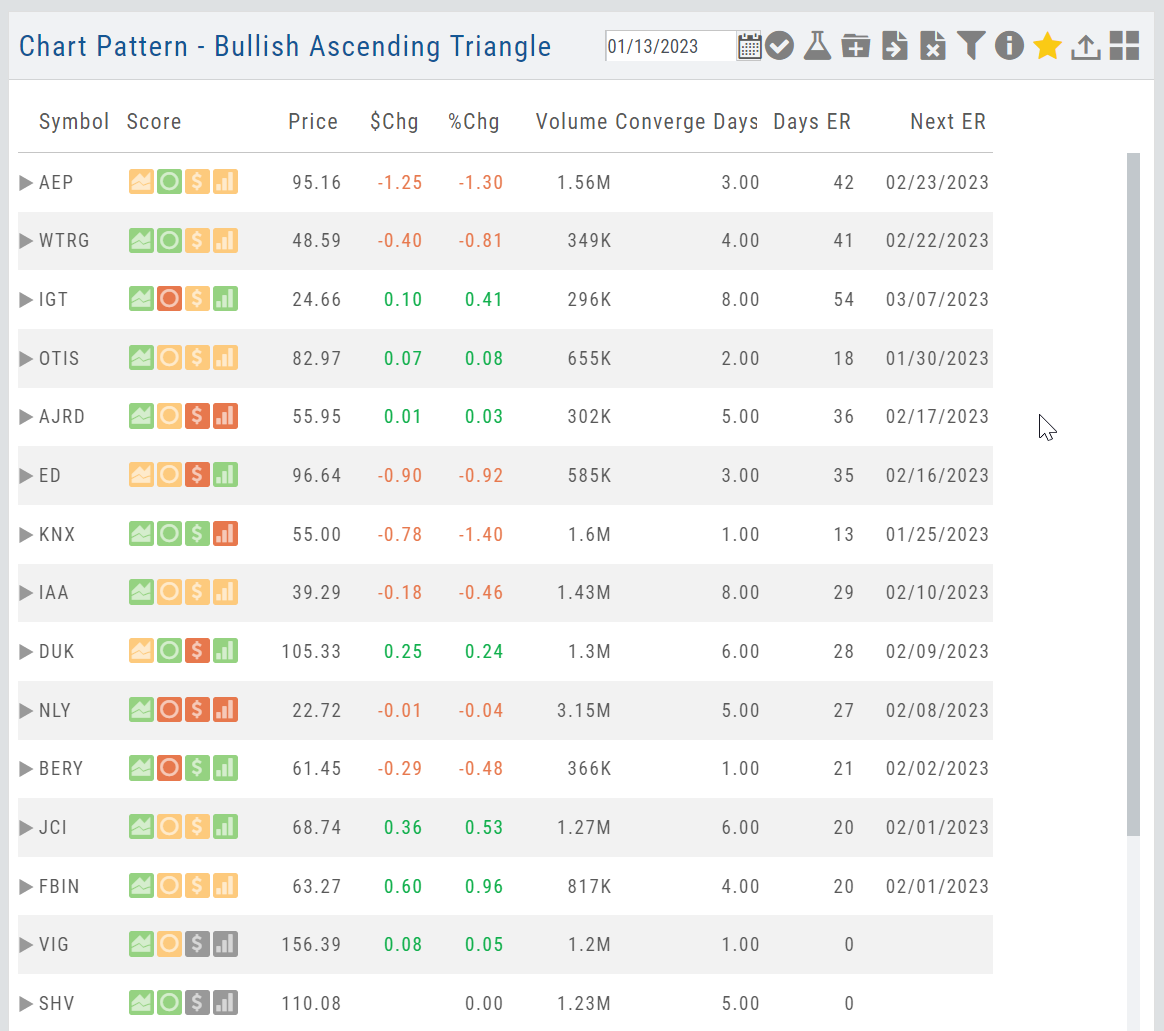
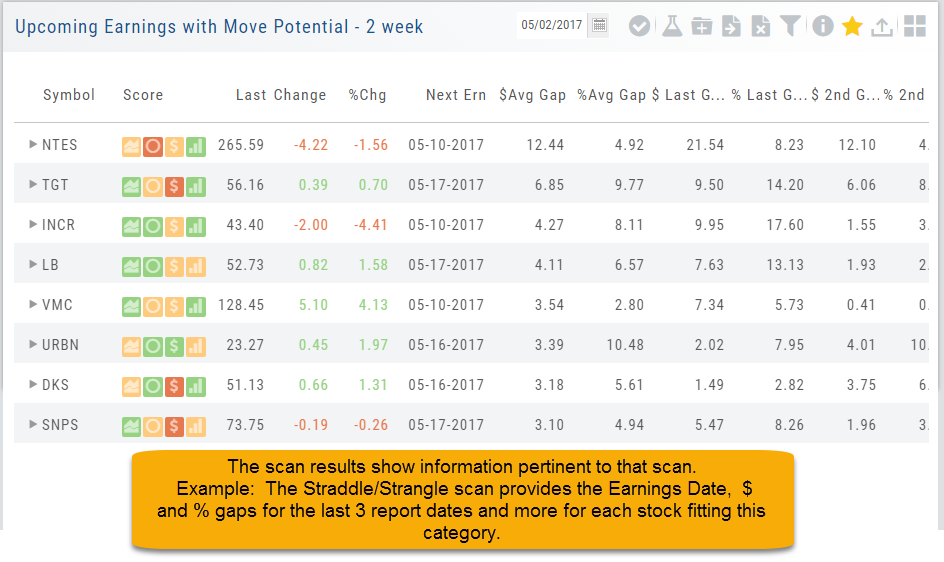
Dynamic Scan Information
The scan results provide relevant information for that scan. For example: Dividends will show Yield, Covered Calls will show the options position, potential return, net cost and more.
This allows you to quickly pick stock candidates and bypass others for high-probability trades. For example, you may wish to eliminate stocks priced too high or low, those with low volume, etc. Use the Navigational tools (Action Icon, The Score Icon, Send to Watchlist or Research for example) to dive deeper in selecting the best stock.
Filter Scan Icon
The Filter icon ![]() – located in the upper left area of the scan page – allows you to narrow candidates of an initial scan by applying additional parameters.
– located in the upper left area of the scan page – allows you to narrow candidates of an initial scan by applying additional parameters.
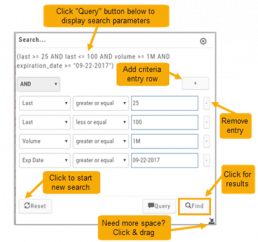
You can adjust the criteria at any time to further narrow or increase the number of results by eliminating, adding or adjusting entries.
This Smart Search feature filters data unique to the scan. Ex: Covered Calls Filtering offers Net Entry Cost, $ Return with no Movement, $ Return if Called out, etc.
Use drop-down box to select parameters and enter criteria in boxes.
Add rows if needed by clicking on ‘+’
If you need more space, click and drag the arrow in the bottom, right corner.
Click “Find”.
Click ‘Reset’ to start over. The “Query” button displays the criteria at the top of the Filter page. Click again to remove.
Give it a try!
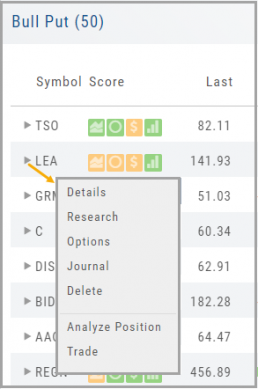
Smart Action Icon
The Smart Action Icon ![]() adjusts available features depending upon where you are in the trading platform.
adjusts available features depending upon where you are in the trading platform.
For Stocks you can ‘Buy’, ‘Sell’, view ‘Options’, etc. 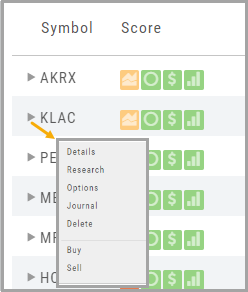
Any Strategy-specific options scan will have ‘Analyze’ and ‘Trade’ in the Action Icon Menu. You can click ‘Analyze’ to see the trade in the options chain. From there, you can Edit the structure or click ‘Trade’ to submit the trade to your to Brokerage Account and Journal.
Scan - Smart search
The search box is found at the top of Find. It performs ‘smart searches’ by pulling all scans related to what is typed in. If you don’t know the name of the specific scan, but know it is related to Earning announcements, type “earning” and a list will populate showing scans that are about Earning. Typing “Bull” or “Bear” will bring up scans with “Bull or Bullish” or “Bear or Bearish” in their names, respectively.
Of course, you can also elect to search by clicking the arrow for a complete list of available scans in a drop-down search.