Platform Features Release: March 2023
Announcing the latest features/functions updates, additions, or edits to the trading platform:
Valuation and Fundamental Data Points added
Users have more criteria to select from for both the Screener, to find potential trade candidates, and Watchlist Views to analyze candidates.
Valuation and Fundamental Data Points Added
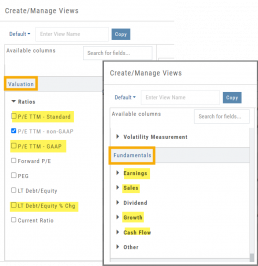
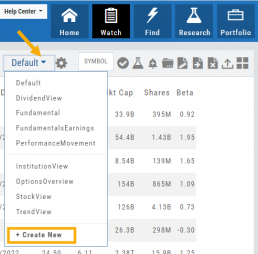
Watch List Views
Over 30 data points were added to the Valuation and Fundamental sections for Watch List Views.
Build, Save, and Edit your customized Watch List Views to your needs.
Learn how to use this feature:
Screener
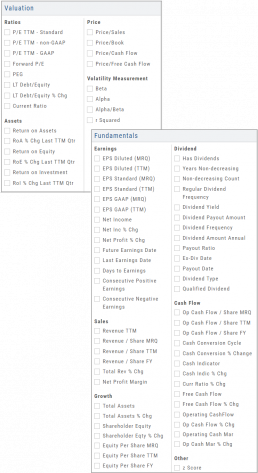
Over 30 data points have been added to the Screener Function under the Valuation and Fundamental sections.
There are 3 Levels of Data Points. Level 2 has more Data Points than 1, Level 3 has all criteria available to select from.
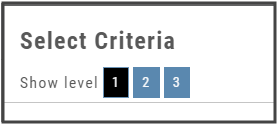
Now users have more tools to choose customize screens. These may be saved and edited at any time.
Enhancements
- Added Average Volume line to (upper) Volume Indicator
- Saving Annotations/Texts, etc on charts are an automatic function. It no longer has to be selected.
- Scroll function added to lists on Custom, Market and Watch pages
- GAAP/non-GAAP PE/PEG (TPE and PE chart in Valuation section to reflect GAAP PE)
Change Log
- Resolved Screener Export Function
- Open/Close “save” function fixed in Backtest mode
- 2nd email saving in Notification feature setup
- Candlesticks and Volume bars line up
Platform Features Release: December 2022
Announcing the latest Release which added a powerful Lower Indicator on the Charts Tab: 52 Week Hi/Lo. Price/Date info has been added to X/Y axis
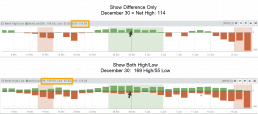
52-Week Hi/Low Indicator
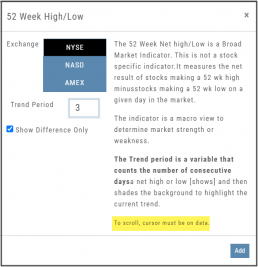
The newest lower indicator: 52-week Hi/Low Indicator is a Broad Market Indicator. It is not Stock specific.
View how individual Stocks/ETFs are faring compared to the Broad Market.
Select from NYSE, NASD or AmEx
There are two views:
Show Difference Only – Display either a green or red (or no) bar representing the net advancers/decliners for that period.
Show High & Low (uncheck box)– Displays both green/red bars to illustrate number with new 52 week high/lows.
The background color identifies a bullish or bearish trend, based upon the number of days selected (Trend Period)
Example: If 3 days are selected, background highlight will begin on the 4th consecutive day of gains (or losses).
X/Y axis – Price/Date display
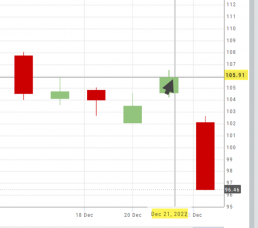
The cursor’s crosshairs will display the Price/Date info along the X/Y axis for easier reading.
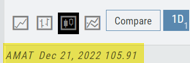
This information will still appear in the upper/right corner above the chart:
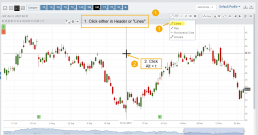
Drawing Key Activation
Use your keypad to activate drawing lines on the Chart by following these steps:
1. Click either in Header area above the chart – OR –
Click the Annotation icon>Line
2. Click on chart, then “Alt” and “T” keys where you want to start line.
Once activated from either of the starting points (1), the function works on the current chart, without having to reactivate by clicking on the Header or Annotation icon.
Platform Features Release: November 2022
Announcing the latest Release allowing for customized Watchlist views. Improvements in Journal functionality will increase responsiveness and allow users to better control the data displayed. Format enhancements were also made to increase readability
Watchlist Views – Create, Save & Edit
The ability to create your own Watchlist views based on criteria important to you enhances the work flow of finding the best candidates for trading.
Click on ![]() next to the (Default) Watchlist, then select “Add New” to get started.
next to the (Default) Watchlist, then select “Add New” to get started.
Build your own views from over 160 data points, then adjust the display position in the order you want them to appear.
Click on ![]() icon to edit a view you previously created.
icon to edit a view you previously created.
Learn more by clicking below:
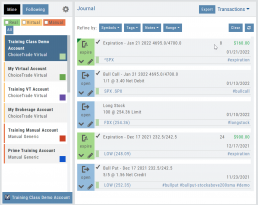
Improvements
The Journal default displays Order/Trade activity from the Activated Trade Account.
To switch or add accounts, simply click on the other Account tabs or select by group: Real, Virtual, Manual or All accounts.

The improved functionality allows for faster journal activity display and easier trade analysis.
Change Log
- Resolved Score Icon Navigation from Home/Market Tab
- Corrected Fundamental/Dividend missing data
- Moving Average indicator functionality restored on Custom Page
- Corrected display data on Fundamental Tab
- Addressed candlestick not appearing first 20 minutes on Mondays.
- Rectified downloading data from Screener
Customize Watchlist Views
Customize Watchlist Views
You have the ability to customize Watchlist Views – based upon criteria you want to see.
Click on the ![]() next to “Default” or current view you are on to create a different View.
next to “Default” or current view you are on to create a different View.
If/When you want to edit any of your personal views, simply click the ![]() icon, remove/add criteria, adjust placement, then click “Save”.
icon, remove/add criteria, adjust placement, then click “Save”.
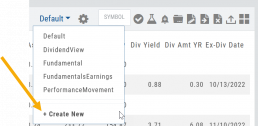
From Assets to Z-Score, there are over 160 data points to select from including data from: Company Information, Technicals, Valuation, Fundamentals & Options.
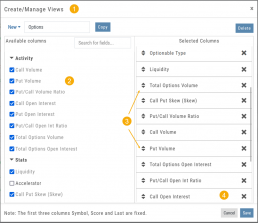
Simply:
1. Name the View
2. Select Data Points
3. Arrange – clicking on arrows to move up/down
4. Save
Your Watchlists are now more powerful because they show the data you want to see to help you make your trade decisions.
The Result:
Note: The Symbol, Score Icons and Last Price are fixed
Platform Features Release: Additional Alert Functionality, Watch List Alerts, Info Button, Trade from Charts
Features Release Notes:
Additional Alert Capability, Set Watchlist Alerts, Alert Management Info Button, New Trade Button on Charts
Announcing: Expanded Alert Capabilities, Watchlist Alerts Information Button, Trade Function from Charts
We’ve increased Alert capabilities to give users more ability to identify trade entry, exit and management opportunities. An Info button (i) is added to on the Alert Management Page to assist/guide users on the criteria offered.
Set Alerts by Watchlist as well as individual symbol.
Trade functionality is available from the Charts, streamlining the process when you have an existing trade or staged trade. Where there are more than one position on the same symbol, you’ll be given the option of what action to take.
Increased Alert Functionality
Set Alerts by Watchlist
You are able to set Alerts on your Personal Watchlists . There are 2 ways to do this:
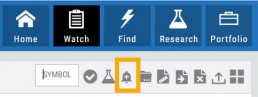
1. On the Watch Tab using the Alert Icon in the Icon bar
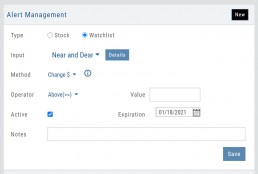
2. The Alert Management Page, click “Watchlist”, then select from the drop-down which will automatically populate available lists to choose from.
Criteria available for single stock/etf symbols are available to set for an entire watchlist, include Real Time, up to 6 month activation and the ability to add Notes.
Clicking the “Detail” button will display the symbols contained in the selected Watchlist
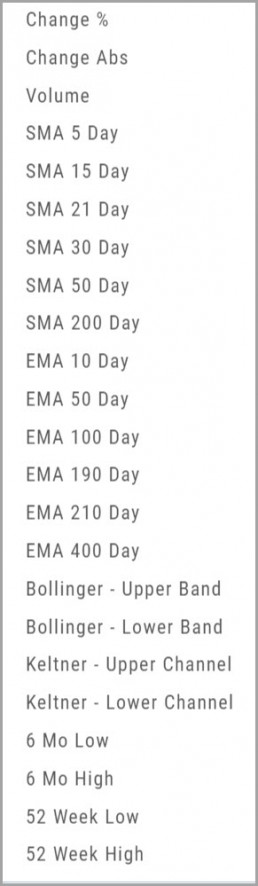
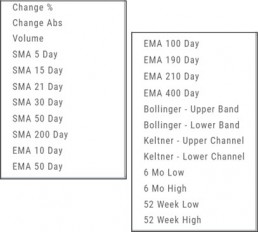
With the exception of Last Price, all Methods are available for both individual alerts as well as Watchlist Alerts.
Simple Moving Average
Exponential Moving Average
Bollinger Bands
Keltner Channels
6 Month Hi/Low
52 Week Hi/Low
As you see, SMA & EMA offer numerous time periods. The shorter the time period, the more alerts you will receive – especially when set on Watchlists.
Note: The Active Alert box on the left side of the Alert Management page will have ‘wl‘ indicated when the alert is on a Watchlist.
A Reminder on Alerts:
Alerts are RealTime if you have Streaming Quotes on the platform – OR – have a linked brokerage account that provides RealTime quotes to the platform – AND – have logged into that account in the last 30 days.
Alerts on OTC stocks will be delayed
Make sure to enable “Push Notifications” on your computer as well as mobile devices (if you have the app downloaded). You do not have to be logged into the platform to receive alerts as long as you have these notices activated.
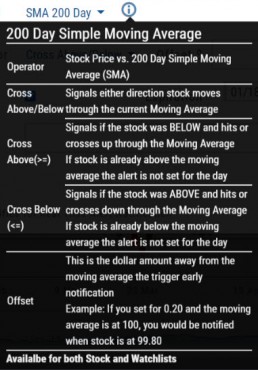
Information Button – Alert Management Page
An Information Button has been added to the Alert Management page.
Located next to the Method drop-down, (i) clicking on this button will display in-depth information on criteria available to set your alerts.

Trade from Charts (Live, Virtual, Manual or Staged Orders)
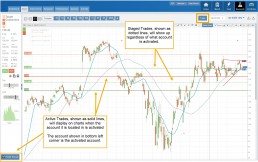
Submitting existing trades or staged orders is streamlined.
In the example chart above, there are two staged orders and a Live Trade.
Clicking “Trade“, located above the stock chart , will display a menu of an existing trade(s) in the activated trade account.
Staged Orders, on the same symbol, will display regardless of the trade account activated.
Staged orders will be shown in bold/black.
Active trades, whether Live, Virtual or Manual will be shown lighter/blue.
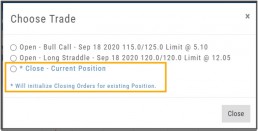
To the right is what displays after clicking “Trade”:
1. Open (Enter) the Bull Call Position
2. Open (Enter) the Straddle Position
3. Close the existing Active Trade (Manual, Virtual or Live)
The next action will take you to the Order Ticket to continue the trade process, as usual.
Change Log
- Ability to save Backtested trades after Market hours restored
- Dividend display corrected
- Adjusted links in BZ news
- Mobile App – scrolling issue resolved in Scans
Alert Functionality (Premium Desktop Feature)
Alert Functionality
Alerts can greatly improve trading effectiveness by notifying you on a potential trade opportunity and help you decide when to manage, enter or exit a trade.
Set up Alert notifications based on Last Price, Volume, $ Change, % Change, or % Offset.
If you’ve logged into the platform with either Streaming Quotes or RealTime Quotes through a linked brokerage account *within the last 30 days* – Alerts will be Real Time.
Alert Icons
- Add (+) New Alert – This icon is located on the symbol Quote Box
- Hollow Bell – Active Alert, not triggered
- Shaking Bell – Triggered alert, not yet viewed
- Solid Bell – Alert triggered today, already viewed
- Paused (z) or Used Alert – located in Alert Management Page

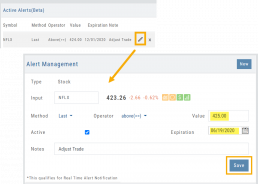
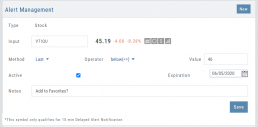
Set Your Alert
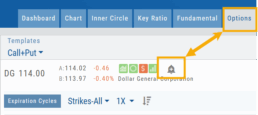
Click the Alert Icon, located on the symbol Quote Box and as shown on the Option Tab for the Chain or Strategy Template. The symbol, Score Icons, Last Price, $ and % Change automatically fill in. To complete the rest:
-
-
- Select Method: 23 to choose from! See list below
- Select Operator: Above/Equal To or Below/Equal To
- Enter Value: $, % or Quantity (Quantity example: 11,000,000 or 11M)
- Select Expiration: Valid up to 6 months. Click on Calendar Icon to navigate months
- Add Notes, if desired
- Click Save
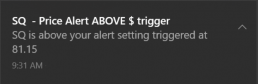
An Information notification appears: Alert Successfully Saved
-
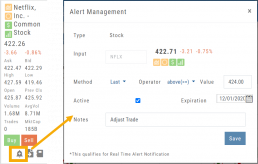
Alert Management
Manage your Alerts by going to: Research Tab>Alerts.
From this page, you can modify or remove alerts, view unread triggered alerts in one location and view prior alerts.
-
-
- Select Method: See List on right
- Select Operator: Above/Equal To or Below/Equal To
- Enter Value: $, % or Quantity (Quantity example: 11,000,000 or 11M)
- Select Expiration: Valid up to 6 months. Click on Calendar Icon to navigate months
- Add Notes, if desired
- Click Save
An Information notification appears: Alert Successfully Saved
-
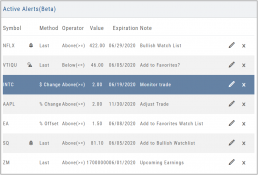
Active Alerts
This table lists all active alerts including:
Trigger notification – A bell icon appears if alert was triggered
Delayed Alert icon, if applicable
Settings – Method, Operator, Value
Expiration Date – Alerts can be active for up to 6 months
Notes
Ability to modify or remove from list
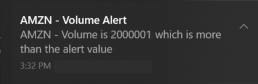
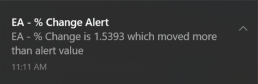
Alert Notifications
In addition to platform notifications, as long as you allow notifications, alerts can be sent to your computer or mobile device even if you are not logged into the platform.
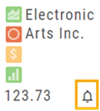
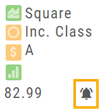
Hollow Bell
The Hollow Bell indicates this Alert is Active, but has not been Triggeredwill appear next to the symbol whether on the QuoteBox in Research or on a Watchlist .
Ringing Bell
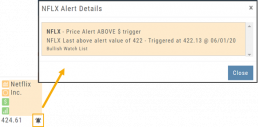
The Ringing Bell icon indicates the alert has been triggered and notification sent out. The highlighted area on the Quote Box or where it appears on a Watch List allows you to access the alert notification by clicking on the bell.
This display will show until the alert is read either from a Watch List, Quote Box or the Alert History section of the Alert Page.
Solid Bell
Once an Alert is read or “Marked As Read” on the Alert Notification page, the icon becomes a Solid Bell.
Clicking on the icon will still display the triggered alert until the next Market Day.
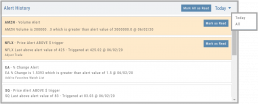
Alert History
This section displays triggered alerts for the time period selected: Today or All. The highlighted entries are Unread Notifications – the notices were not clicked on from the platform.
Click “Mark All as Read” to update entries.
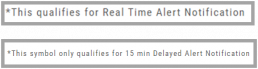
A note about Real-Time & Delayed Alerts
Note: There are two ways 15 minute Delayed Alert Notification applies with Alerts:
1. If it’s been more than 30 days since a linked brokerage account with RealTime Quotes has been logged into – OR – the platform does not have Streaming Quotes.
2. OTC stocks will show as delayed, regardless of RealTime or Streaming Quotes
One of two notices will appear for each Alert
Custom (Premium Desktop Feature)
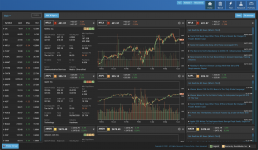
Custom Page – Customize What You Want To See
Custom Page
You’ll find Custom under the Home tab (formerly Market tab). Trade Central gives you a one-stop view of your selected Stocks/ETFs. Add Quote Boxes, Multiple Charts and News for your selections and overall Market News.
Rearrange the content to fit your preferences, the platform will adjust to maximize the view according to the device you are using.
This is a flexible feature with a number of ways to structure the Custom page. The widgets are adjustable, allowing you to rearrange, add, substitute or remove as needed.
Read below to learn more and get started:
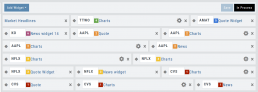
Add Widgets
Check the box for “Quote“, “Chart“, and/or “News” and enter quantity for each then click “Enter”.
Add the Symbol in the appropriate box for the data to populate.
Note: To remove a widget, click the ‘x’ in the upper right corner of the box.
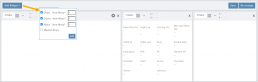
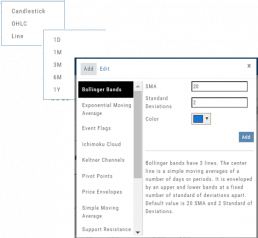
Chart Widget
After adding “Chart” widget and Stock/ETF symbol, click the Gear Icon (upper right corner of widget box) to select:
Time Period: 1 Day, 1 Month, 3 Month, 6 Month or 1 Year
Chart Types: Candlestick, OHLC or Line
Indicators: Over a dozen indicators available to add to each chart. You can edit and remove/change selected indicators on each chart.
Custom lets you add multiple chart set-ups per Symbol for a convenient way to research existing trades or find opportunities.
Widget Settings
Rather than enter a symbol on each Chart, Quote or News component, you can assign a number to each widget.
Then, using the Watchlist displayed on the left side of the screen, click the Action Icon (triangle) to left of Stock Symbol you want to display and assign a number, 1 thru 12
The widgets with that number will automatically populate accordingly.
To change displaying one symbol to another using a Watchlist, simply click on the Action Icon of new Symbol and select the number of the current Symbol you want to replace.
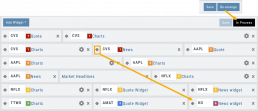
Adjust Custom Display
Adjust the order display by clicking on the Re-Arrange button on the Upper Right corner of Trade Central screen.
The display changes to placeholder bars for easy drag/drop action. Re-Arrange button changes to “In Process“.
Click on the Bulls-Eye icon to the left of the Stock/ETF symbol, then drag/drop to new location.
When completed, click on “Save“, then “In Process” to return to Trade Central main view.
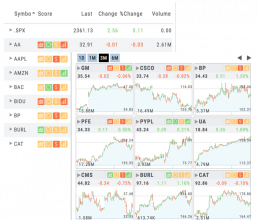
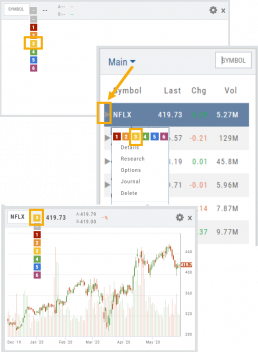
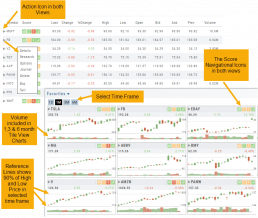
List or Tile View
View any list in traditional List View or Tile View —both show The Score.
Tile View shows thumbnail charts of the entire list. These can be viewed in a variety of periodicies. Volume is included in the 1, 3 & 6 month views to assist with quick analysis. Horizontal Reference Lines show where the Low Price and 90% of the High Price points the stock had for the selected time period.
The Score icons are also navigation shortcuts which will take you directly to Charts, Inner Circle, Valuation or Fundamentals.
Clicking on the Action Icon ![]() next to the Stock symbol in either the List or Tile View will bring up a menu offering additional choices for that Stock.
next to the Stock symbol in either the List or Tile View will bring up a menu offering additional choices for that Stock.
Create Watchlists
The Market & Watch Tab Icon ToolBar allows you to Create/Modify/Manage your Lists.
Hover your cursor over the icon to view it’s ‘task’: 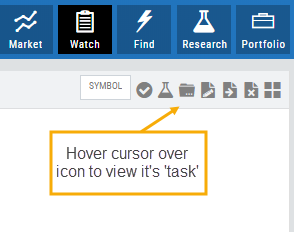
Select Candidates
Send to Research
Create/Delete a List
Modify an existing List
Send candidates from one List to another
Remove candidates from existing List
Change View: List or Tile
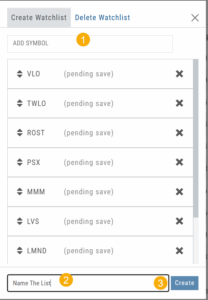
To Create a New Watchlist:
1. Under ‘Create Watchlist’, enter symbols to automatically add
2. Enter the name of New Watchlist
3. Click “Create”
Other ways to Create Lists include:
Research>Chart>”Recents” list.
From the Find Tab>Scans and Find Tab>Calendar.
Selecting candidates from Scans (Ex: Bullish Ascending Triangle ) or Calendar for an Earnings or Dividend date to get the list of stocks that fit your selected criteria, click the “Check” icon to the stock symbols you want to keep, then click the Folder + icon to , name your new Watch List then click “OK”.
You can also copy/paste up to 100 symbols from an outside source to a newly created (or existing list) provided the following apply:
The symbols are separated by:
A Space: TSLA ZM GOOG NFLX
Or by a Comma: TSLA,ZM,GOOG,NFLX
Or a Return:
TSLA
ZM
GOOG
NFLX
Icon Navigation
More than a picture, icons will help guide you through the trading process.
This graphic shows the function of some of the icons found in The Trade Tool.
Hint: Most icons will display a short description of its function or purpose by hovering the cursor over it.
![]()