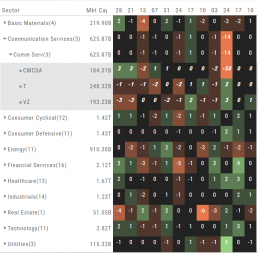
In the Spectrum view, each column represents the slice of time selected: Day, Week, Month or Trailing Quarter. Once the Time frame is selected, it will be backtracked in each column (Example: April, March, February, January…)
Each row of the selected Index are initially broken down by Sector. By clicking the ‘action icon’, the Industry groups are shown. Clicking on the ‘action icon’ of each Industry will display the Stock symbols within that Industry.
The number and color of each box is a ‘slice’ that represents change (+/- , neutral) for that slice of time for that Sector, Industry or Stock using the Spectrum Color Legend as a reference.
Note the ‘action icon’ next to the Stock Symbol, enabling you to drill down, add to Watchlist, Research, Journal, etc.