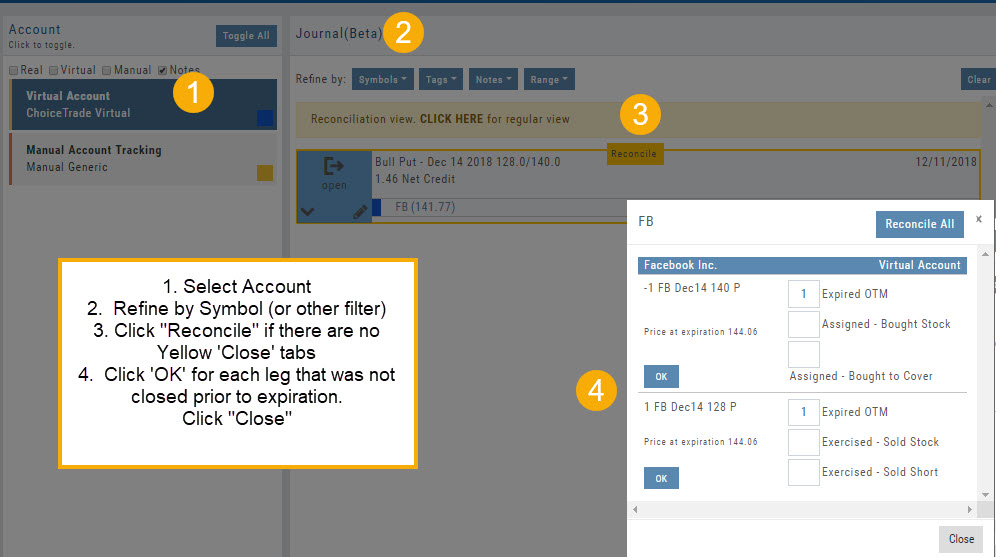
Updating Journal Entries
Logging into your account will update Journal entries for up to the last two months. However, trades that expired will need to be Reconciled. If the system is unable to match trades, a Yellow ‘Close’ tab will result, requiring manual action to close.
Follow the steps as shown below to reconcile your trades.
Note: Step 2 is not required, however, if you are just learning to use the Journal and it’s features, sorting by Symbol, especially if you have multiple trades, simplifies the process.
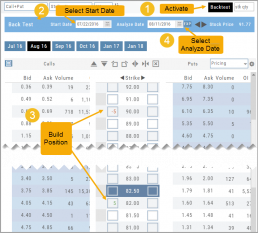
How to use Backtesting
Activate by clicking “Backtest” in the upper right of the Option Table screen.
- Select a start date.
- Enter position in the options chain.
- Select analyze date.
Your position’s P/L Performance and Risk Chart are dynamically updated.
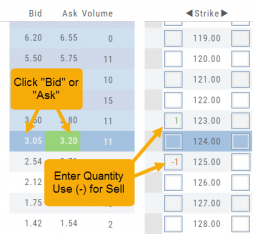
Entering a Position
You can enter a position to analyze by clicking on ‘Ask’ for buying or ‘Bid’ for selling. You can also directly enter the quantity in the entry box. (Note: make sure to indicate a selling position with a minus (-) sign).
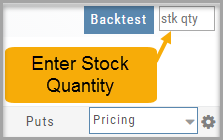
For positions that include the underlying stock, such as Covered Calls, Protective Puts & Collars, enter the stock quantity in the upper right corner of the chain window.
You can change the click quantity amount by changing the default-click parameter (found at the top of the Option Table) for 1x, 5x or 10x.
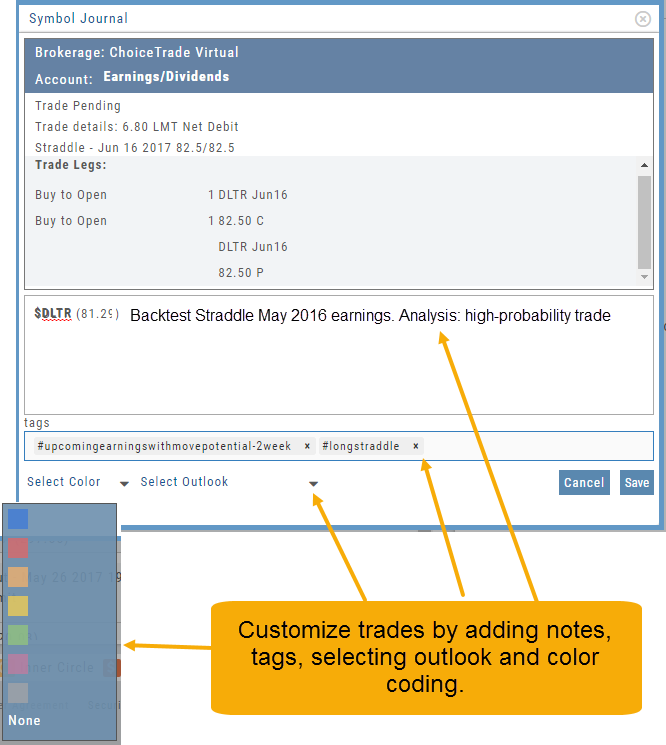
Symbol Journal
This is more than just documenting trades
This Journal has benefits and features that allow you to truly customize a vital part of the trading process. Each trade allows you to: Make Notes, add Tags for organizational purposes as well as Color Tags you customize, Outlook icons further customize each trade entry.
Customizing Indicators
Customize Indicator Settings – even in different Chart Profiles!
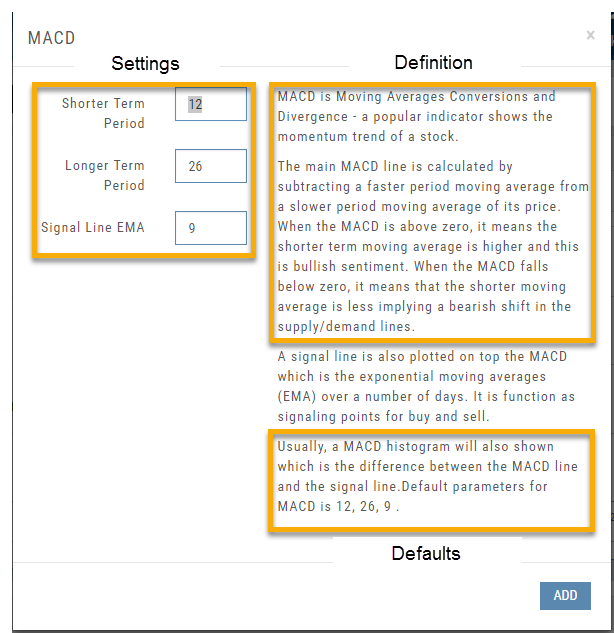
Customize the settings by clicking on the “Add Indicator” box at the top, center of the screen. Scroll to the Indicator you wish to add/edit. Left-click on the selection for a customization box to appear.
The Indicator window shows which settings can be changed.
Bonus! You can save different settings for the same indicator in different chart profiles. No need to change settings from one profile to the next.
In addition to the settings, this feature also provides a description of the indicator and the default settings.
Start Date
Click the Calendar and select any past Market date. You can quickly choose a previous date by clicking on the “month” then arrow back by year. The closing price for that stock will be displayed.
You are now ready to create the position to analyze – either by clicking “Bid” or “Ask” or by entering the quantity in the appropriate box(es).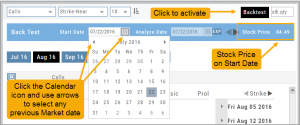
Note: In order to ‘backtest’, the platform needs to establish an orientation point in time. If you change the ‘start date’, the option expiration cycle may change to re-establish the reference point in which to pull information from.
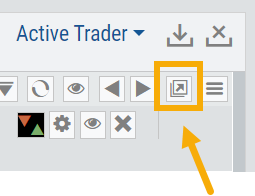
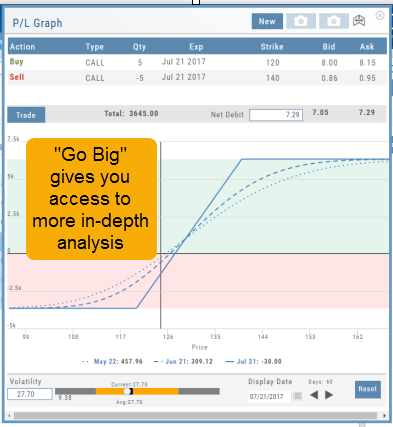
Go Big - Graphs & Charts
Anywhere you see the ‘Go Big’ icon ![]() , you can expand the graphic and access additional information.
, you can expand the graphic and access additional information.
The Chart Tab under Research has such a button in the icon toolbar as shown:
The Heat Map on the Market Tab will allow you to filter criteria such as stock price, volume, market cap, etc. 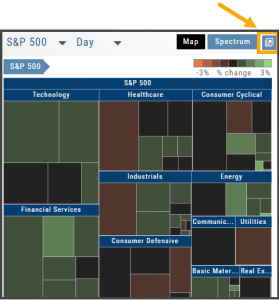
In the Options Tab, you can do this with the P/L Graph and the Volatility Chart. The icon is located at or near the upper right of the graph or chart.
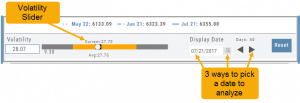
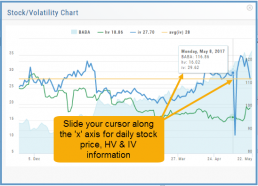
Expanding the Stock/Volatility Chart allows you to view past Historic Volatility, Intrinsic Volatility and stock price on a day-to-day basis.
For deeper Trade Analysis, use the Volatility Slider tool and the Date Picker, located at the bottom of the P&L Graph:
Trend Lines, Notes & Shapes and Advanced Annotations
Customize your charts with Trend Lines, Notes and Advanced Annotations.
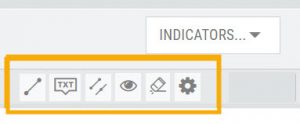 These tool icons are available above the chart, just below the Indicators drop-down box.
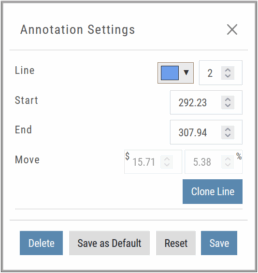
Each Annotation can have a Default Setting. This means all initially created lines, for example, will have the same settings, such as color and thickness.
Select your Annotation.
Draw it on the chart.
Click to display the dialog setting.
Adjust settings, then click “Save as Default.”
“Reset” will revert to initial settings.
You can still customize individual lines by saving the settings instead of saving as Default.
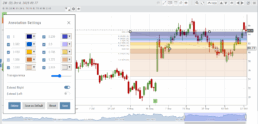
Fibonacci Too!
The Fibonacci Annotation has been enhanced to allow you to select which Retracement Levels you want to view, in addition to adjusting the color for each and the overall transparency.
The settings can be set as the Default for new chart entries or customize each entry, then “Save”.
**Please note: Existing Fibonacci annotations cannot be edited with this new coding. They must be deleted, then added back.
In addition, individual retracements can be extended Right and/or Left. Click the annotation on the chart to open the dialog box.
Note: The Extend Right/Left option cannot be set as a default setting.
Clicking on any Trend Line, Note, or Advanced Annotation, will display the “Annotation Settings” box for that entry.
The Annotation Settings box can be repositioned elsewhere on the platform, if needed.
Line Color, Line Width and if applicable, Background Color and Transparency can be changed.
Be sure to click ‘Save’!
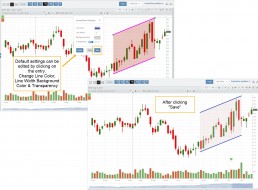
Note: Parallel channels are initially drawn horizontally. To change orientation click on the annotation then grab one of the ‘edit dots’ to drag to the position you wish.
Then click “Save” on the dialog box.
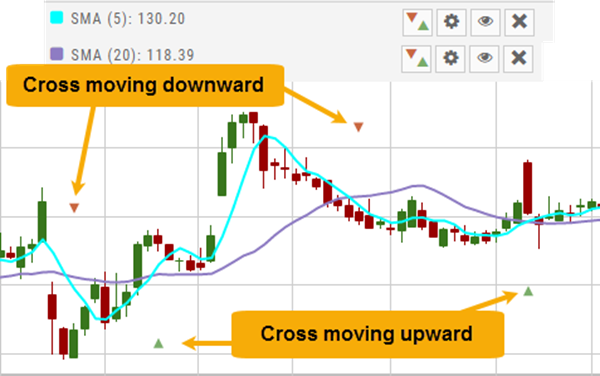
Crossover Arrows
The Crossover Arrows ![]() identify the crossover points on indicators.
identify the crossover points on indicators.
For upper indicators, you can select 2 indicators and the chart will show the crossover arrow.
Example: If you select the 5 day and 20 day SMA the Green arrows will show the 5/20 crossover points when in an upward movement, Red for downward.
Only 2 moving averages can be selected at a time when utilizing this tool. If you wish to make a change to another moving average indicator, one must first be deselected before adding the new indicator.
indication
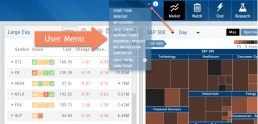
User Menu
Take a tour, have a question, change the theme – all from one place.
The User Menu is one of the 6-point Navigation system of this trading platform. You can access The Help Center from here, ask a support question, check your account, suggest a feature idea or provide feedback on the platform, even change the platform ‘theme’ (example “light” or “dark”) and more.
