Strategy Snapshot
It’s the “Cliffnotes” version of your strategy
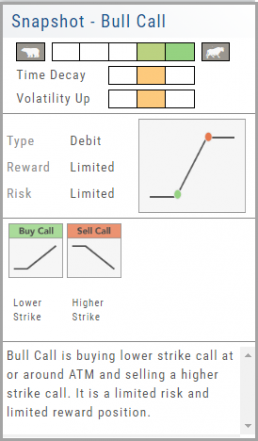
Each strategy template provides a quick reference for the construction and application of the strategy. The snapshot shows:
- what the strategy outlook is on the color-coded range from ‘Very Bearish’, ‘Mildly Bearish’, ‘Neutral’, ‘Mildly Bullish’ or ‘Very Bullish’.
- what effect ‘time decay’ and ‘volatility’ has on the strategy: ‘Increase’, ‘Neutral’ or ‘Decrease’.
- debit or credit trade
- risk & reward level
- strategy structure
- an overview summary of the strategy
Option Tables & Templates
Expanding your Options!
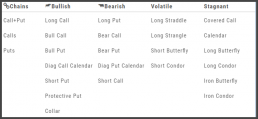
Choose from Call+Put chains, Call Matrix, Put Matrix or from almost 2 dozen Option Templates – covering any market outlook.
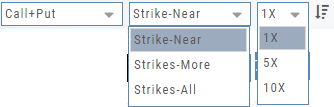
Expand the Strikes displayed: Near ATM, More or All.
You can change the click Quantity default increment by changing the default parameter for 1x, 5x or 10x.
You can also sort the Strike prices: Lowest to Highest, or vice-versa.
Advanced Analytics
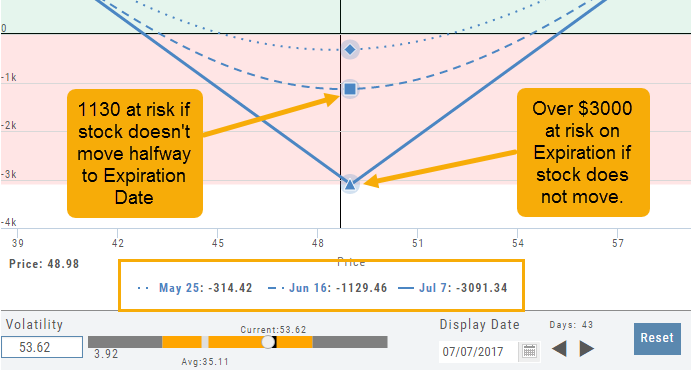
Some strategies are more responsive to time decay and/or volatility than others. This platform has tools to help analyze these components.
- Construct the position in the Option Chain table
- Select the ‘Go Big’ icon on the P&L Graph
- The Graph shows 3 data points: Current Day, Halfway point to Expiration Day & Expiration Day. The corresponding legend, immediately below the graph, follows the cursor slider along the graph.
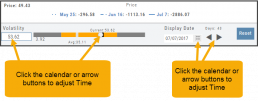
- The bottom of the screen contains a Calendar (Time) & Volatility Scale. Both can be manipulated to analyze the position.
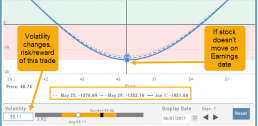
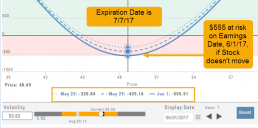
Time: You can select a date to analyze as well as user stepper buttons to move day by day backward or forward.
Volatility: Use the volatility slider or enter a value in the entry box to see the impact of changes in volatility. The slider bar also displays the current (circle), average (gray), and 1 year high / low of implied volatility (orange portion of the slider) for easy reference.
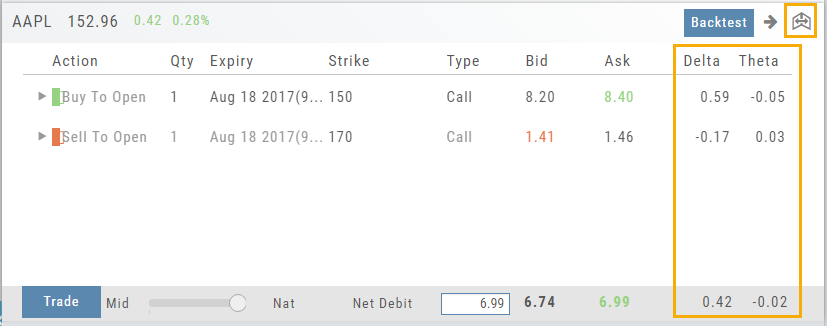
Delta & Theta Display on Template
You can expand the template to show Delta and Theta for the individual legs as well as the totals for the trade by clicking the ![]() icon on the upper right part of this screen.
icon on the upper right part of this screen.
This can help for faster evaluation and better positioning of the trade.
Save your Favorite Scans
Create your Customized Scan List
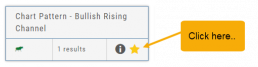
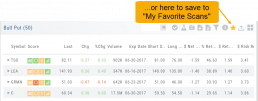
Star any scan to have it show in Feature > My Favorite Scans.
There are two ways to do this:
Simply click the star ![]() on the Tile View of the scans or on the header in the results view of any scan.
on the Tile View of the scans or on the header in the results view of any scan.
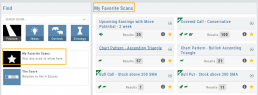
Favorites will be easily access from the Scan main page
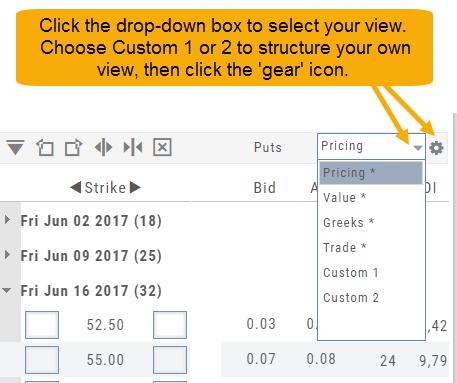
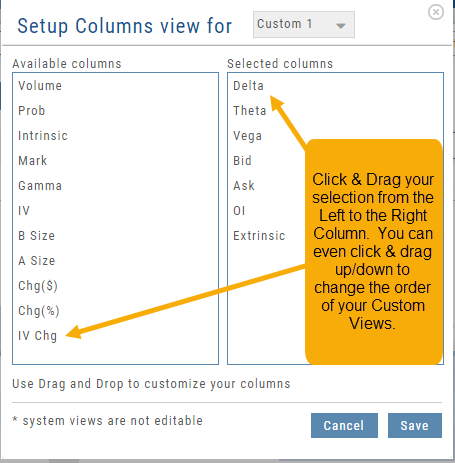
Create Customized Option Table Views
Create, edit and re-create custom Option Views.
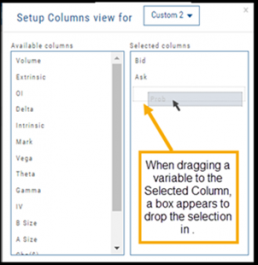
This feature allows you to create up to two customized Option Tables. Add/remove categories or even change the order of category columns by clicking on the criteria, then drag/drop it to the new location.
Click ‘save’ and you’re done.
Note: You can change the order of your variables you select by clicking/dragging the variable up or down. The custom views can be changed at any time – to adjust to the user’s needs.
Evaluate Existing Positions
Positions will automatically show on the options chain for the active brokerage account.
You can also access directly from Broker Positions. Select “Analyze” from the Action menu. 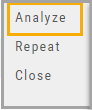
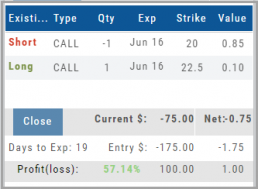
This will display the current values as well as entry cost and current P/L.
Here you can also close the position or evaluate adjustments on the trade.
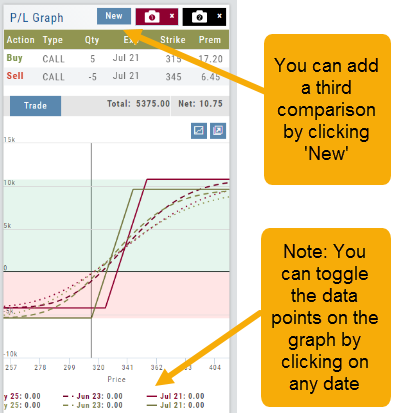
Snapshot: Comparing Positions
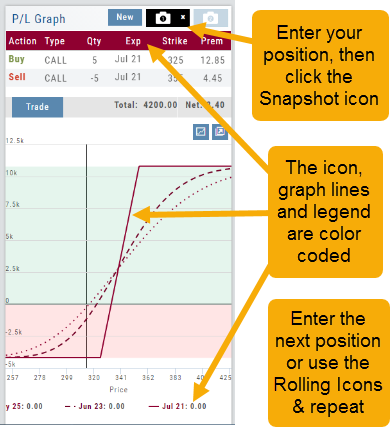
The Snapshot feature gives you the ability to compare up to three scenarios in one view without having to change screens or erase previous setups. You can even submit a trade from this part of the platform!
- From the Calls+Puts chain (as well as “Calls” or “Puts”) enter the initial trade position.
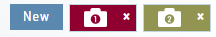
- Next click one of the camera icons:
- Repeat the first step using the Rolling Icons to adjust the initial position to a new scenario:
- Click the 2nd camera icon & repeat the above steps for the last trade comparison.
Note: The position lines are color coded to match the Snapshot (or New) icon.
Once you decide on the optimal position, click ‘Trade’ from the P&L Graph and you’ll be taken to the Order Ticket of your brokerage account with the option information auto-filled. 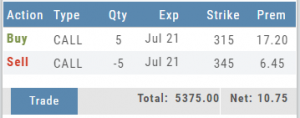
Rolling Positions
It’s easier & faster to evaluate your Trade
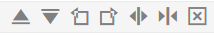
Once you have entered a position, you can easily make adjustments for further evaluation using the group of Rolling Icons in the upper-center part of the Option Table.
These icons will allow you to move the whole position: 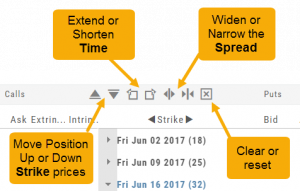
Up or Down Strike Prices
Extend or Shorten Time
Widen or Narrow the Spread
The [X] acts as a clear function. Clicking once will clear the current positions in the chain. Clicking a second time will act as “all clear”. This will clear any snapshot trades and fully reset the option chain.
Elements of the Template
The Trade Finder Templates are designed to allow you to ‘visually trade’.
When evaluating a position, a Bull Put for example, the template automatically sets up the trade. You can use the rolling icons to adjust the position: Roll the position up/down, roll out the time frame, adjust the strikes, etc. You can even adjust the Net Credit(Debit) of the trade in an attempt to get a more favorable entry cost/credit.
The Performance Channels show the profit/loss of the position.
The P/L summary at the bottom left of the screen shows the Risk/Reward ratio, Net/Total Credit (Debit),the break-even stock price point, the max reward/max risk with corresponding stock price.
A snapshot on the right side of the screen, provides a visual structure of the strategy, what market 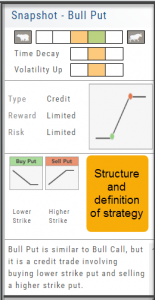 conditions are favorable to the trade, whether volatility and/or time positively, negatively or is neutralized by the strategy.
Greeks and Volatility are also shown.
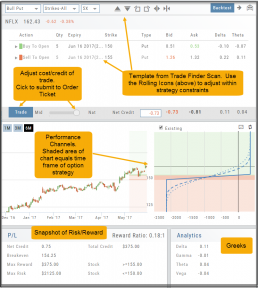
Once satisfied with the position set-up, click ‘Trade’ and the order will auto-fill in the “Order Ticket” of your brokerage account.
Important! While adjustments may to the template may be made, the system limits what can be changed in order to stay within the constraints of the strategy. This safety measure ensures you stay in the type of trade you intend to be in.