Intraday Trade Finder Scan Updates (Premium Desktop Feature)
Trade Finder Scans are updated every 30 minutes during Market Hours on the Premium Platform. That’s 12 more times than the Standard Platform version, which updates once after the Market opens.
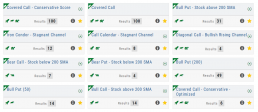
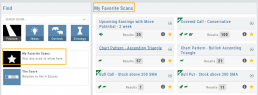
Trade Finder Scans are easily identified with a Rocket Icon in the upper left corner of the Scan box.
Scans - Find Opportunities - Overview
Stagnant? Uncertain? Bearish or Bullish? Short or long term? No problem!
This “Find” category is where to find opportunities based on current Market activity and outlook, or select opportunities based on events, such as Earnings or Dividend announcements.
Whether looking for opportunities based on The Score, Events, Chart Patterns, Bullish, Bearish, Stagnant or Unknown outlook, a scan will help you find potential trade opportunities. 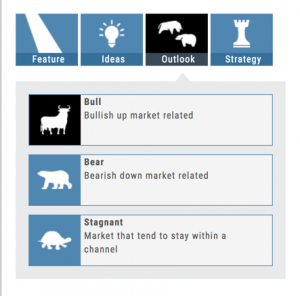
You can drill-down for scans by Category, Sub-Categories, then Group.
Example: Strategy>Time Spreads>Call Calendar Spreads. You can use the drop-down box, above the Category boxes to search for the scan you want or type in the box a generality about the scan. Examples: “Earning”, “Bull”, “Bearish”. “Score”, “Red”, “Green” will yield scans with that particular name in the scan
The Dashboard Scan Tab
Get the current ‘story’ on a stock.
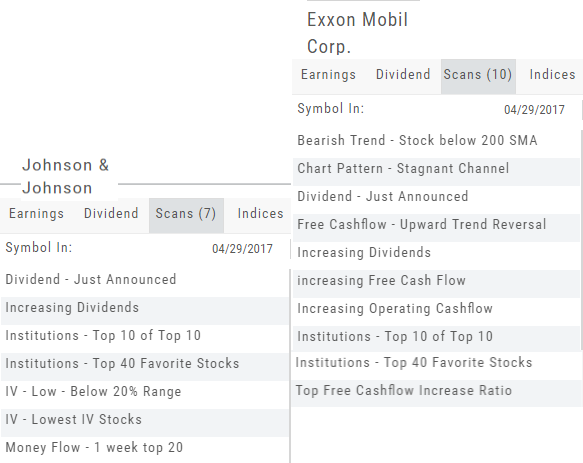
The Scan Tab is particularly interesting. In addition to providing a list of scans the stock is currently included in, it can give you a “story” about the stock. Based on the scans that the stock is showing up in, you can get an overview of outlook on the stock.
For example: JNJ shows solid longer term positive outlook.
XOM Shows stagnant with improving longer term outlook
Create Watchlists
The Market & Watch Tab Icon ToolBar allows you to Create/Modify/Manage your Lists.
Hover your cursor over the icon to view it’s ‘task’: 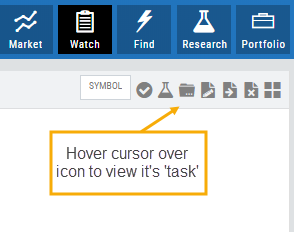
Select Candidates
Send to Research
Create/Delete a List
Modify an existing List
Send candidates from one List to another
Remove candidates from existing List
Change View: List or Tile
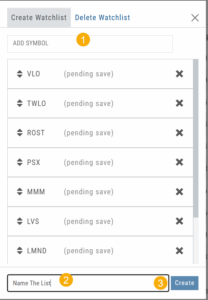
To Create a New Watchlist:
1. Under ‘Create Watchlist’, enter symbols to automatically add
2. Enter the name of New Watchlist
3. Click “Create”
Other ways to Create Lists include:
Research>Chart>”Recents” list.
From the Find Tab>Scans and Find Tab>Calendar.
Selecting candidates from Scans (Ex: Bullish Ascending Triangle ) or Calendar for an Earnings or Dividend date to get the list of stocks that fit your selected criteria, click the “Check” icon to the stock symbols you want to keep, then click the Folder + icon to , name your new Watch List then click “OK”.
You can also copy/paste up to 100 symbols from an outside source to a newly created (or existing list) provided the following apply:
The symbols are separated by:
A Space: TSLA ZM GOOG NFLX
Or by a Comma: TSLA,ZM,GOOG,NFLX
Or a Return:
TSLA
ZM
GOOG
NFLX
The Top 4 Categories
The names may be different, but the scans remain the same! 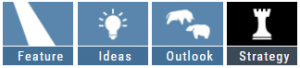
Feature – Your favorite and our highlighted scans, including scans related to The Score.
Ideas – Scans for general ideas including Dividends, Money Flow, Volatility, Earnings and more.
Outlook – For Bearish, Bullish and Stagnant outlook conditions.
Strategy – Over 20 strategy-specific scans including Bull Put, Bear Call, Iron Condor and more.
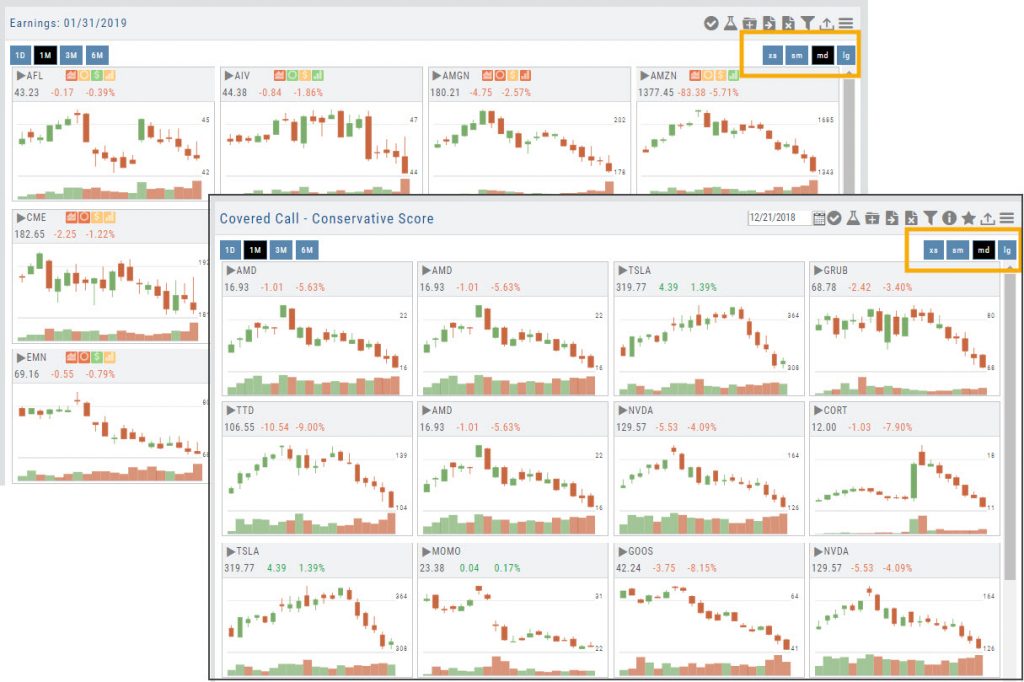
Tile View Sizes
Tile View is available in 3 sizes on the Market or Watch Tabs.
Scans and Earnings/Dividends Calendar under the Find tab offer 4 Tile View sizes: Extra Small to Large.
The platform’s adaptive and responsive technology will automatically adjust the number of tiles shown based upon the available space as well as allow continual scrolling for large lists.
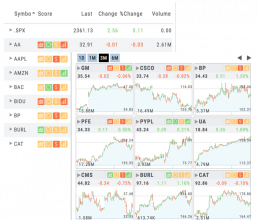
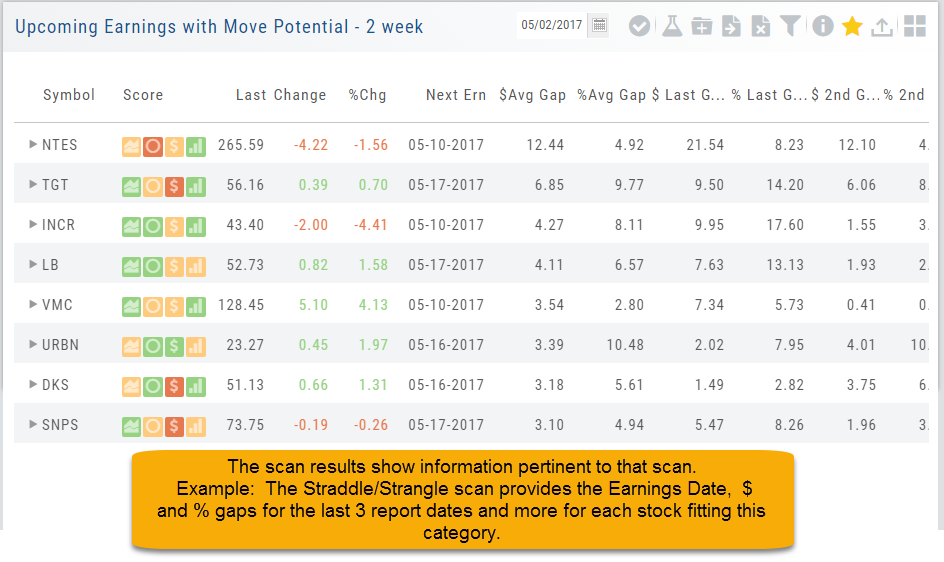
Dynamic Scan Information
The scan results provide relevant information for that scan. For example: Dividends will show Yield, Covered Calls will show the options position, potential return, net cost and more.
This allows you to quickly pick stock candidates and bypass others for high-probability trades. For example, you may wish to eliminate stocks priced too high or low, those with low volume, etc. Use the Navigational tools (Action Icon, The Score Icon, Send to Watchlist or Research for example) to dive deeper in selecting the best stock.
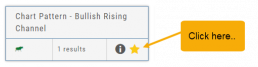
Save your Favorite Scans
Create your Customized Scan List
Star any scan to have it show in Feature > My Favorite Scans.
There are two ways to do this:
Simply click the star ![]() on the Tile View of the scans or on the header in the results view of any scan.
on the Tile View of the scans or on the header in the results view of any scan.
Favorites will be easily access from the Scan main page
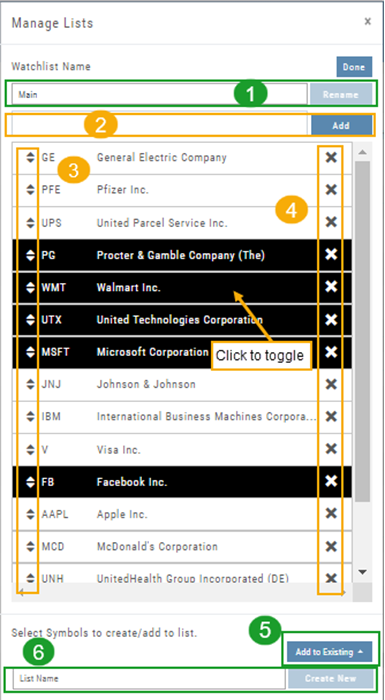
Manage/Modify Watchlists
The Modify feature offers the following Symbol and List Management capabilities in one location:
- Rename the current Watchlist
- Add Symbols to the current Watchlist
- Use up/down arrows to drag/rearrange symbols in selected List
- Remove symbol(s) by clicking on ‘X’
- Highlight symbol(s) to add to another Existing Watchlist
- Highlight symbol(s) to Create a New Watchlist
Bonus! You can keep your Watchlist sorted by any heading using this feature:
Select your Watchlist
Sort by any Heading (Example: Price – High to Low)
Click on the Manage Icon, then click “Done” at the top of the screen
This setting will be ‘sticky’ until you change it.
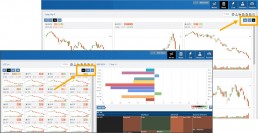
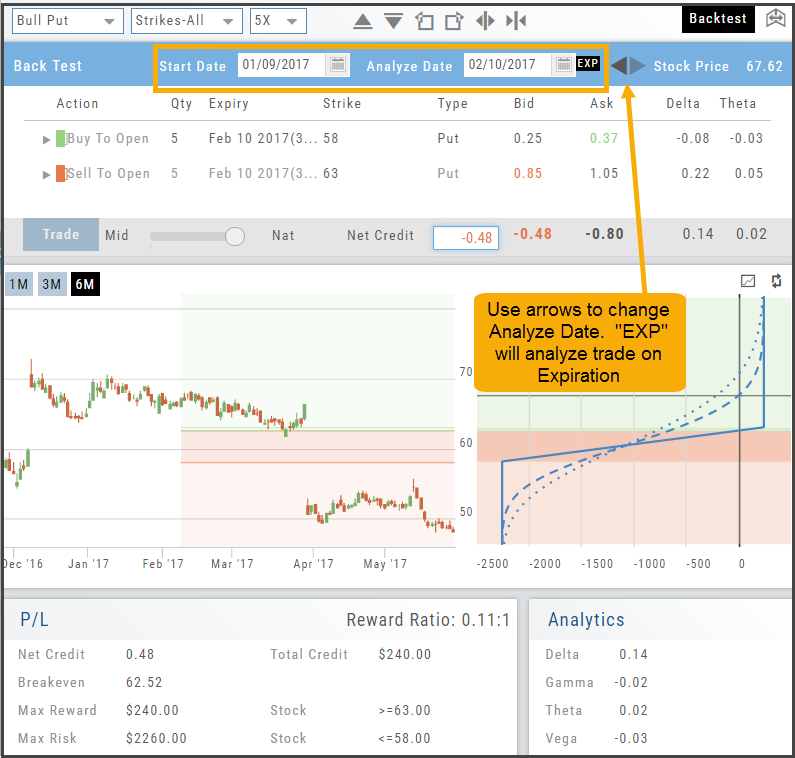
Backtesting Trade Finder scans
You can ‘look back’ (Backtest) Trade Finder Scans by following these steps:
- Select your Scan (example: Bull Put – Stock above 200 SMA).
- Click on the Calendar at the top of the screen to select a previous date (clicking on the month allows you to select a previous month, or arrow back to a previous year).
- Select stock symbol, click on action icon to ‘Analyze Position’.
- The trade template will populate with the specific scan, note the date on the screen is the ‘start date’
- Select the Analyze Date, or click ‘EXP’ to analyze the position on Expiration Day.
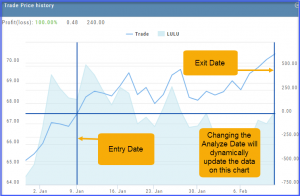
By clicking on the ‘Go Big’ icon of the The Trade Price chart shows the Entry and Exit Dates (cross hairs) as well as the behavior of the trade compared to the stock.
Note: Changing the analyze date dynamically changes the data of the P/L chart.