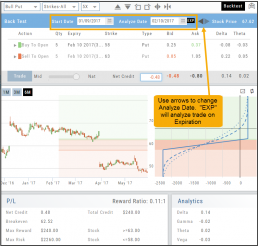
You can ‘look back’ (Backtest) Trade Finder Scans by following these steps:
- Select your Scan (example: Bull Put – Stock above 200 SMA).
- Click on the Calendar at the top of the screen to select a previous date (clicking on the month allows you to select a previous month, or arrow back to a previous year).
- Select stock symbol, click on action icon to ‘Analyze Position’.
- The trade template will populate with the specific scan, note the date on the screen is the ‘start date’
- Select the Analyze Date, or click ‘EXP’ to analyze the position on Expiration Day.
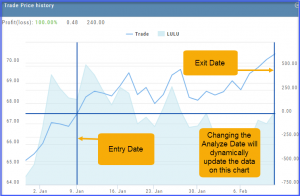
By clicking on the ‘Go Big’ icon of the The Trade Price chart shows the Entry and Exit Dates (cross hairs) as well as the behavior of the trade compared to the stock.
Note: Changing the analyze date dynamically changes the data of the P/L chart.