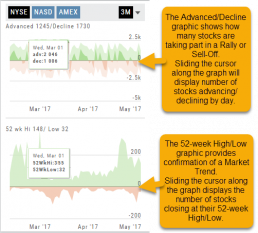
The Graphs on the left side of the Market page can provide confirmation of whether there was a Rally or Sell-Off in the time frame selected by providing the numbers of stocks taking part in of the movement.
The 52-week High/Low Graph further confirms if there is a Market Trend by showing how many stocks closed at their 52-week High/Low.
Note, you can select a 1, 3 or 6 Month or 1 Year time frame in which to view the data. By sliding the cursor along the horizontal ‘0’ (zero) line on each graph, data for each day will appear.