Heat Map & Spectrum Overview
Broad Market Insight that allows you to drill down
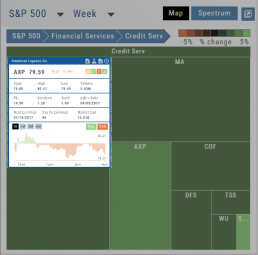
The Heat Maps are accessible in the Market tab and under Find>Explore and provide powerful visual views of market performance. This feature is designed to adapt to a variety of strategies and outlooks according to your portfolio needs. Select Index and Time Frame using the Action Icons. These can be changed going forward in any map screen.
In the Map view, each box represents either an industry group (default) or a stock when you drill down. The size of the box represents the market cap. By hovering your cursor over each box, an info box appears with info on that group within that industry, including the the number of companies, Market Cap, % Change in selected time frame.
Inner Circle - Inside Score
The Insider Score window provides insight into the buying/selling activity of Company insiders. Clicking “Detail” provides more in-depth information on such activity.
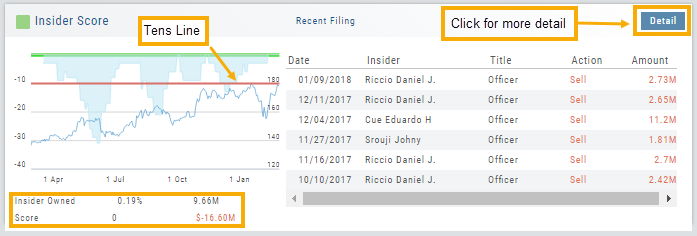
The Tens Line provides a benchmark upon which to base the Inner Circle Score.
Zero & above – indicates net buyers and thus, a Green Score.
Between zero and -10 will yield a Yellow Score, as some insider selling is normal and expected.
A Red Score indicates heavier selling outside of a normal, expected range.
The bottom left of the window shows the % of all shares that are Insider Owned, equivalent $ amount last Quarter, the Score and Net Dollar amount traded last Quarter.
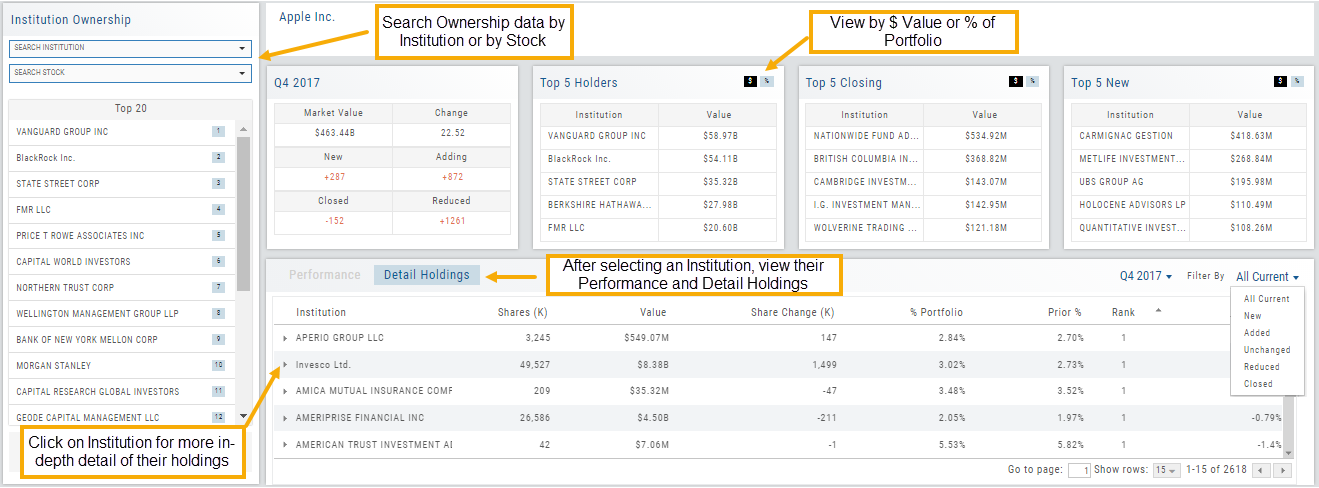
Inner Circle - Institutions
While Insiders are required to update their ownership status within a few days. Institutions are required to do so Quarterly.
The main tile shows data from the most recent reporting Quarter.
% Institutional Ownership and % change (+/-) from the previous Quarter
# of Buyers/Sellers with number gain/loss.
# of Institutions where the Stock is in their Top 10 Holdings
Note the Deadline for the Q1 2018 Report.
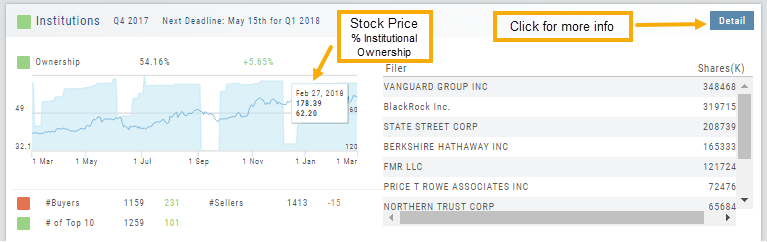
While the # of Buyers grew by 231 in Q4 2017, the number of Sellers outweighing buyers was enough to give this compenent a Red Score.
The # of Institutions holding AAPL grew enough to have a Green Score.
Clicking on “Detail” provides information on the last 20 Quarters. The information is layered allowing you to research ownership data further by Institution or Stock. You can further filter the ownership by those who added, reduced, dropped, unchanged etc. View holdings as a $ value or as a % of the Institutions’ portfolios.
Adjust Chart Height & Width
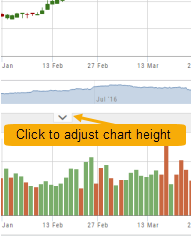
The height of the chart can be adjusted by clicking and dragging the tab under the main chart.
This is a feature unique per device. You can have separate settings for your laptop/desktop,notebook or even tablet.
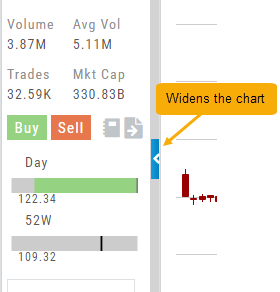
To widen the chart, click the blue tab on the left side of the chart. This will collapse the Quote Bar to the left of the chart. You can ‘undo’ this by clicking the tab again.
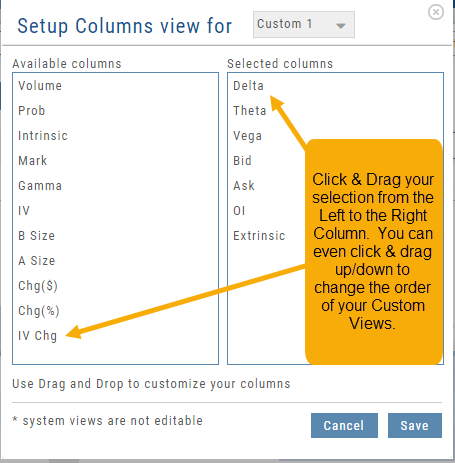
Create Customized Option Table Views
Create, edit and re-create custom Option Views.
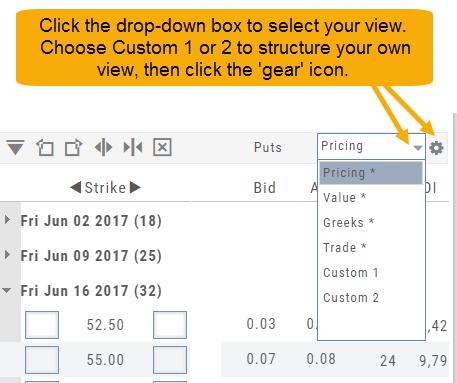
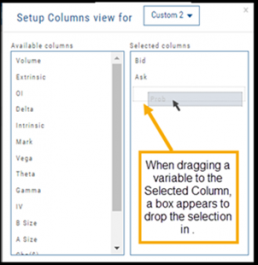
This feature allows you to create up to two customized Option Tables. Add/remove categories or even change the order of category columns by clicking on the criteria, then drag/drop it to the new location.
Click ‘save’ and you’re done.
Note: You can change the order of your variables you select by clicking/dragging the variable up or down. The custom views can be changed at any time – to adjust to the user’s needs.
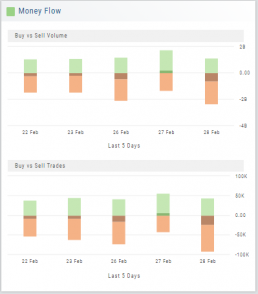
Inner Circle - Money Flow
Activity by Volume & Number of Trades
Money Flow shows trading activity in two views.
The darker shade in the middle of each column – either dark green or red- indicates difference
between the buy/sell volume and buy/sell number of trades.
For example, on February 27th, the top graph shows approx. 1.75 Billion
buying volume from just over 50k trades (bottom graph). Selling volume of
approx 1.5 B resulted from less than 50k trades.
Where the volume and trade columns overlap is an indication of
‘big money’ (Institutions) moving in(dark green)or out (dark red)
of the stock.
Note the dark green line overlap on both graphs for the Feb. 27th example.
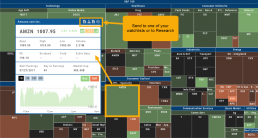
Heat Maps Too
The Heat Maps on the Market page offer the ability to drill down to the stock level. You are able to do this with both the Map and Spectrum views. Clicking on a stock will also show the quote detail. From this you can also send to a list or research.
Additional Option Criteria
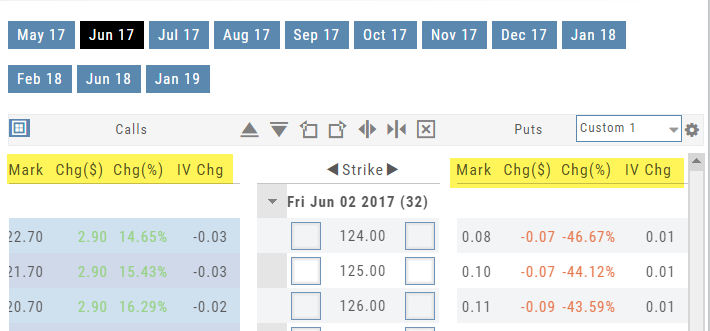
More Option Choices for Customized Option Tables
Mark: The mid-point price between the option’s Bid and Ask
$ Change
% Change
IV Change
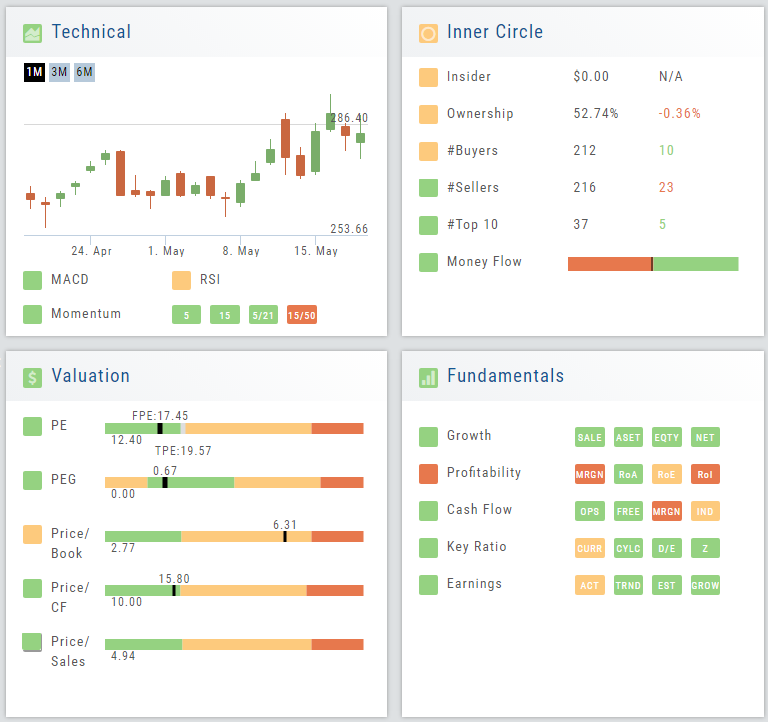
Valuation
Is it Overvalued or Undervalued?
Valuation looks at Key Ratios and Projected Price to evaluate the stock’s current value.
Key Ratios like both trailing and forward PE along with PEG (Price/Earnings/Growth) are weighed.
The Price compared to Book (flow of business), Cash Flow, and Sales are also very important factors to provide a well-rounded synopsis of the valuation modeling of the stock.
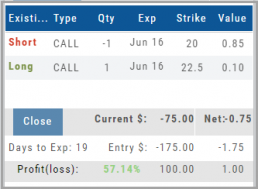
Evaluate Existing Positions
Positions will automatically show on the options chain for the active brokerage account.
You can also access directly from Broker Positions. Select “Analyze” from the Action menu. 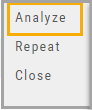
This will display the current values as well as entry cost and current P/L.
Here you can also close the position or evaluate adjustments on the trade.