Order Types - How to Enter
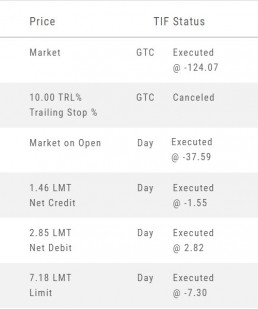
Market Order are Buy or Sell orders to be executed immediately at current the Market Price. Execution of the trade is more important than price. As long as there is a willing buyer or seller, the trade will be executed.
Limit Orders (including Net Debit and Net Credit) allow you to set the Maximum Price to Buy or Minimum Price to Sell a security . Because these orders have ‘limits’ they may not be executed. When they are, they will be executed at the Limit Price – or better.
Low Volume, a slow or very fast market may mean your Limit Price may not be reached and thus, your order not executed.
Stop & Stop Limit Orders
These are protective orders, to be placed on a current position.
A Stop Order becomes a Market Order when the Stop Price is reached. This does not mean you will get the Stop Price when the Order executes. You are willing to Buy/Sell at any price once your Price is reached to have the Order execute.
A Stop Limit Order generally offers more protection: Once the Stop Price is reached, the order converts to a Limit Order to execute once that price – or better- is reached. Thus, there are two values to enter on the Order Ticket for Stop Limit Orders.
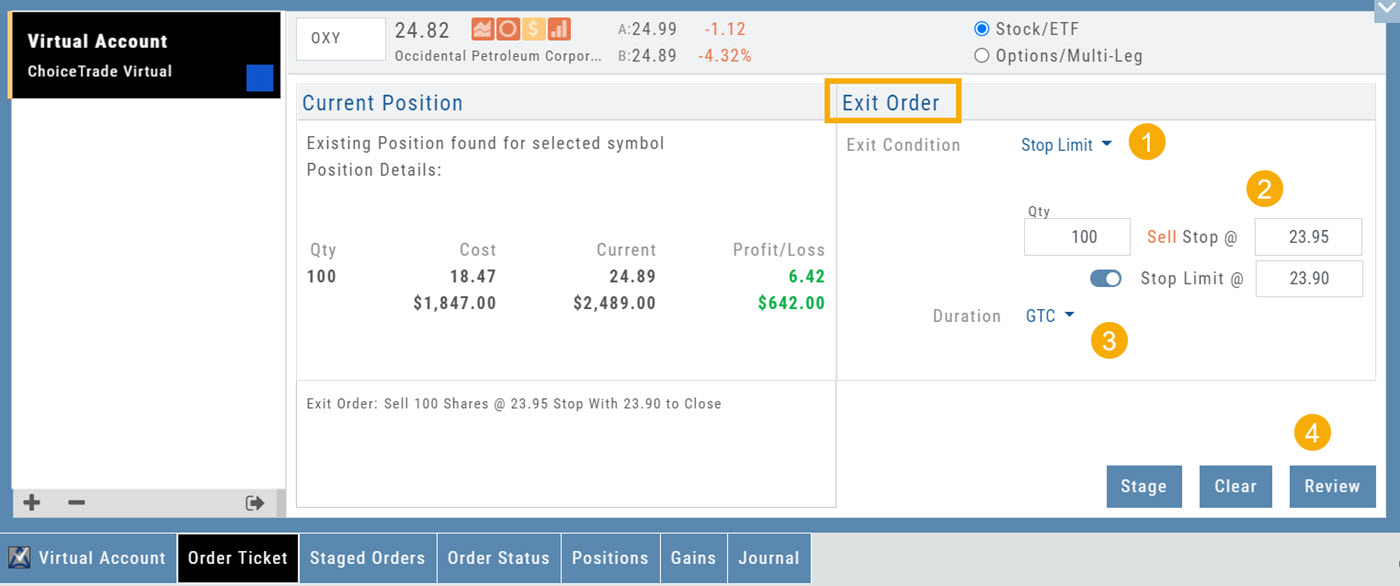
How to enter a Stop Order/Stop Limit Order:
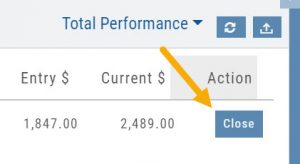
On the Positions tab, click “Close” for the Stock/ETF entry you want to add a Stop/Stop Limit Order to. You’ll be navigated to the Order Ticket tab to continue.
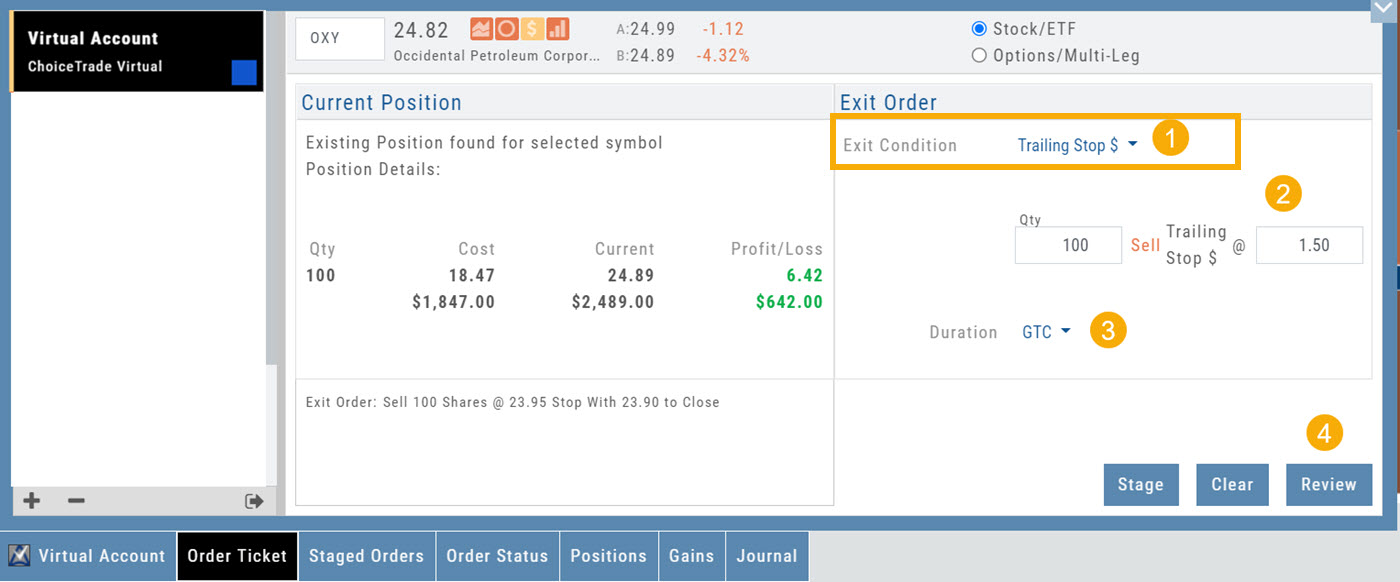
On the right side of the Order Ticket (Exit Order):
1. Change Exit Condition from default “Limit” to “Stop” or “Stop Limit“
2. Enter Stop Price. For Stop Limit Orders, the Stop Price will be the higher of the two values.
Enter Limit Price, if applicable.
3. Change Duration from Day (default) to GTC (which may vary by brokerage)
4. Review & Submit
Notes: As long as it’s not a Day order, the Stop/Stop Limit order will remain Live until you cancel the order or it executes*. (Some brokerages have expiration dates on such orders)
Trailing % and Trailing $
As the names suggest, these orders follow trades upward by a set $ or %. They are placed on a current position. Click “Close” from the Positions Tab, then follow the steps below:
1. Change Exit Condition to “Trailing % (or $)“
2. Enter price or percentage to exit trade
3. Select Duration (Day/GTC)
4. Review, then Submit
This will be a Live Order until it Executes, Expires or is Cancelled.
Bracket Order – One Cancels the Other (OCO)
- Opening Order OR the existing Position to Close
- Select “Bracket (OCO)”
- If the trade is favorable, the Limit Price will trigger to close and secure profit.
- If the trade is unfavorable, this Stop (or Stop Limit) Order can limit your loss
- Duration: “Day” or “Good Til Canceled”
- Summary of the Bracket-OCO Order
- Review for accuracy, then Submit on the next screen
Portfolio - Positions
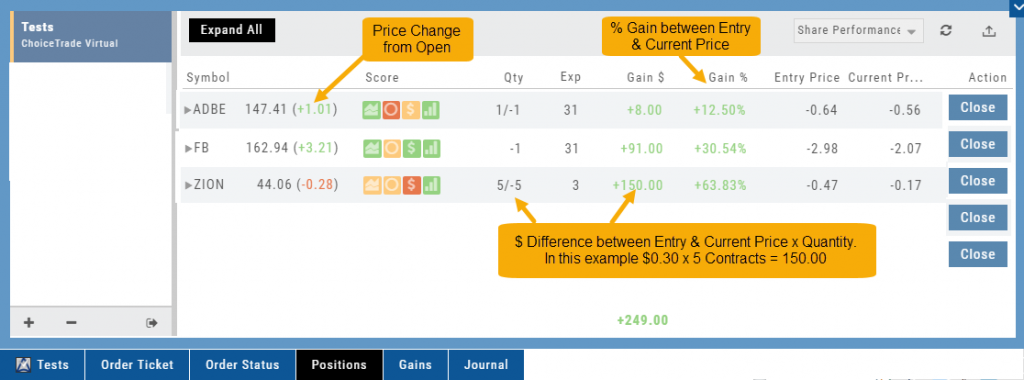
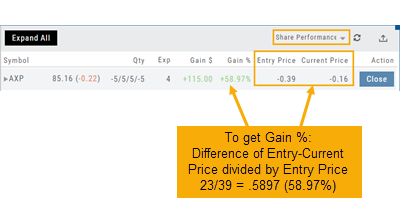
Share Performance View
This view keeps information simple. Aside from the Stock symbol, latest stock price, (price change since open), The Score, Quantity (Lots/Contracts), it shows:
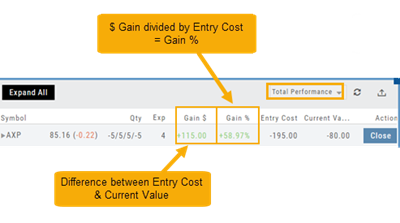
$ Gain (Entry Price – Current Price)
% Gain ($ Gain / Entry price)
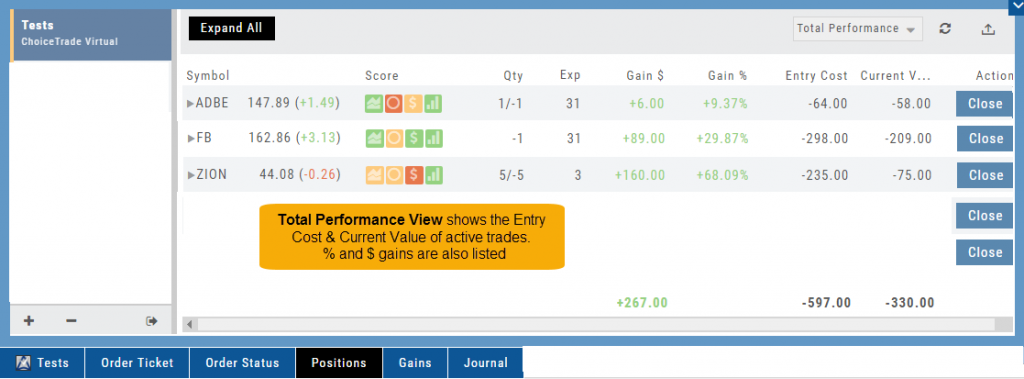
Total Performance View
Similar to Share Performance, this view shows the Entry Cost and Current Value of active trades.
$ Gain and % Gain values are calculated the same way as in the Share Performance view.
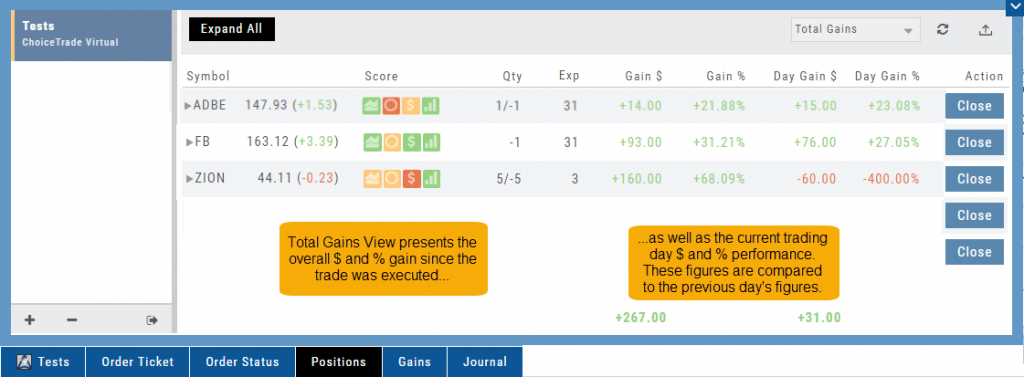
Total Gains
In addition to Gains $ and Gain %, which are to-date values since the trade’s inception, this view displays Day Gain $ and %. The latter show performance on the current trading day in relation to the previous trading day.
In this example on ZION: The previous trading day the $ Gain = $220, and Current Value = $15.00.
The Current Value ‘today’ is $60.00 (a 400% change).
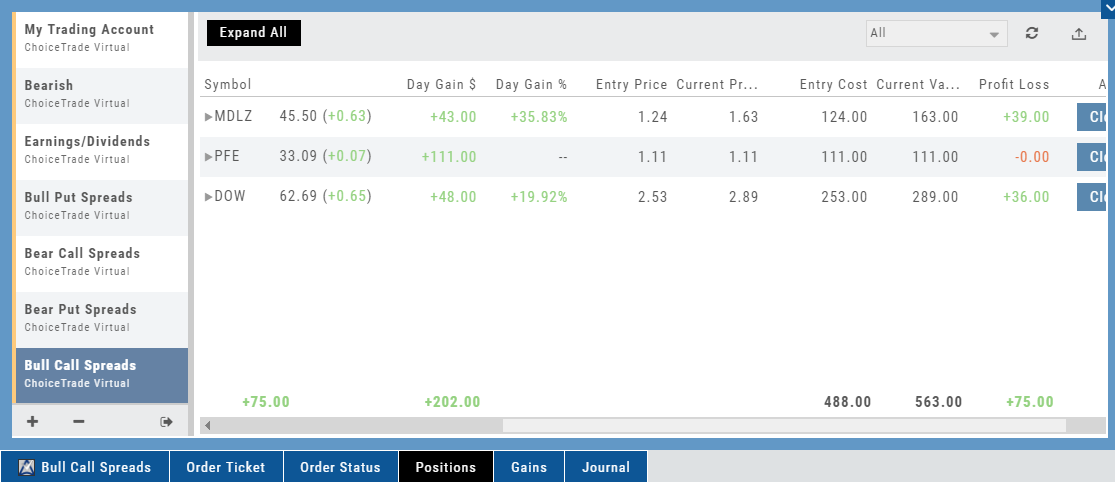
Positions Tab
The Positions Tab offers 4 table views of your current trades. You can access these by clicking on the drop-down box in the upper right of the screen. “All” combines the 4 views. 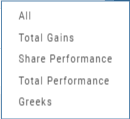
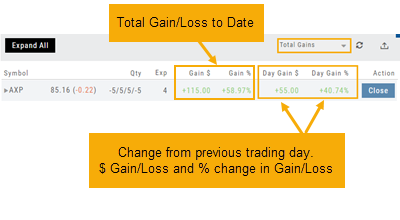
Total Gains
This table view displays the Overall $ and % Gain/Loss and the Daily $ and % Gain/Loss based on the previous trading day’s results.
Share Performance
This table breaks down Total Gains by showing Entry Cost compared to Current Value per Share.
Total Performance
Similar to Share Performance, but shows Total Entry Cost and Total Current Value.
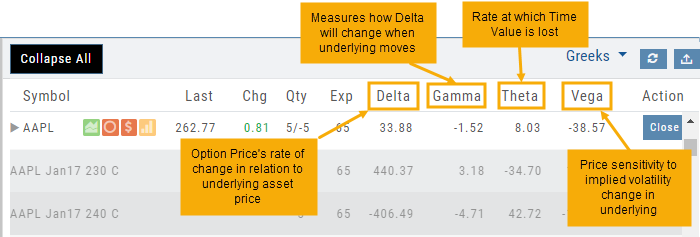
Greeks
Access Trading Account Information
No need to login to Brokerage Account site for normal day-to-day activity.
Each account includes a Summary page showing the Account Balance, Margin Balance, Stock, Option & Day Trading Buying Power and tracks the current trading day’s activity.
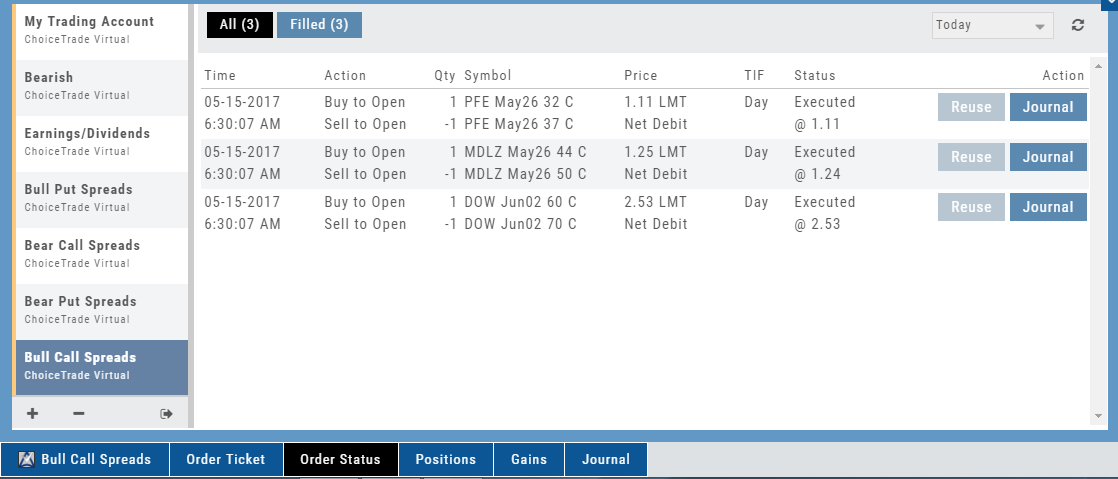
Besides the Order Ticket, the Order Status, Current Positions & Transaction History are all available. You can view previous order history in the Order Status tab by clicking on the drop-down menu on the upper-right corner of that screen.
You can access any account and switch accounts with a single click. You can even change the account from the order ticket.
The newest feature, Journal provides the means of organizing, noting, analyzing & reconciling trades.
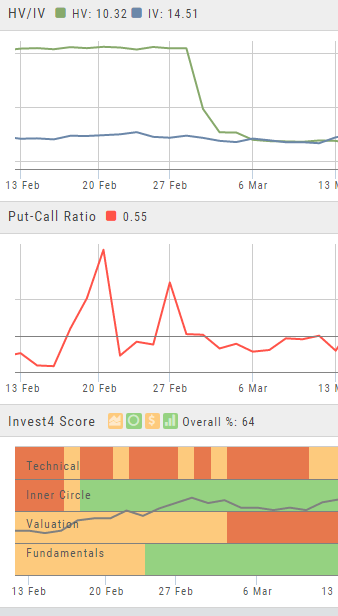
Advanced Indicators
We offer select Advanced Upper and Lower Indicators that are not just derived from the price, including proprietary indicators like “Invest4Score” and “Insider Score”. They are accessible by using the “Add Indicator” drop-down box.
Upper Indicators include:
- Event Flags – showing Earnings and Dividends
- Journal Display
- Support/Resistance
- Extrema Trend Lines
Lower Indicators include:
- Historic Volatility/Implied Volatility
- Insider Score
- Institutional Percentage
- Invest4 Score
- Momentum Score
- Open Interest
- Options Volume
- Put Call Ratios
Fundamentals
A complete perspective of performance in one place.
Fundamentals looks at 20 critical financial analysis ratios in 5 different categories: Growth, Profit, Cash Flow, Key Ratios, and of course, Earnings. 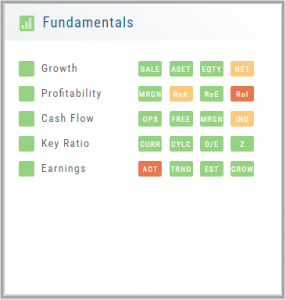
We also take into account Quarter over Quarter, Year over Year, and Trailing Twelve Months’ (TTM) performance with our proprietary weighting formula. View historical data by clicking on the upper right corner buttons in each window.
Fundamentals is the slowest of The Score components to affect stocks, due to the limited times throughout the year data is released. Active investors would generally place more weight on Fundamentals than would a very short-term trader.
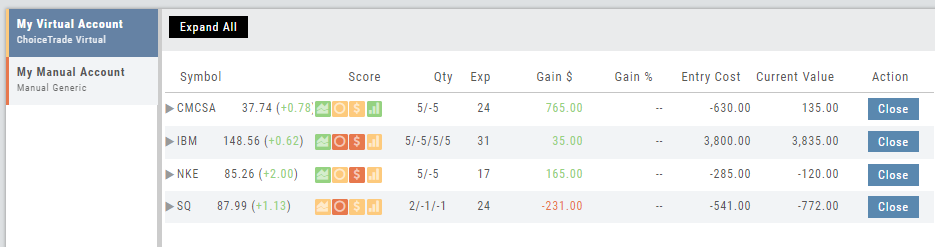
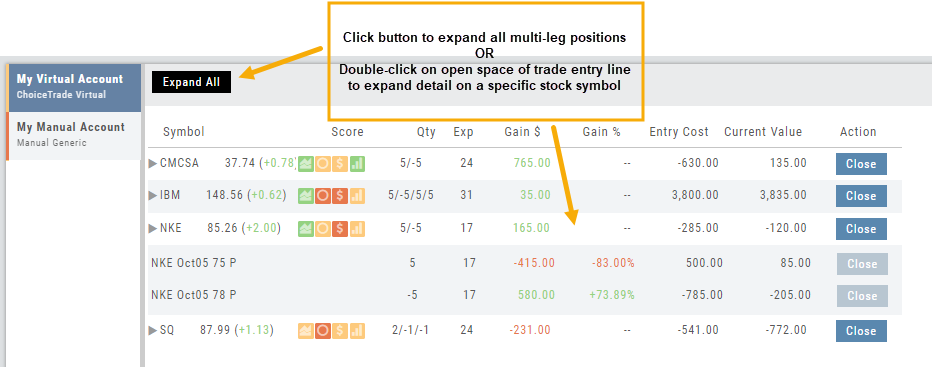
Expand Trade Detail - Positions Tab
There are 3 ways to expand multi-leg trades in the Positions Tab.
Smart Icon – Click on the ![]() icon to the left of the stock symbol, select ‘Expand/Collapse’. Repeat to close.
icon to the left of the stock symbol, select ‘Expand/Collapse’. Repeat to close.
Expand All – Click the button above the trade entries if you wish to expand all multi-leg trades. Once clicked, the button will change to Collapse All.
Double-Click – if you want to expand one trade or specific trades, simply ‘double-click’ on an open space of the trade entry line. Repeat to close.
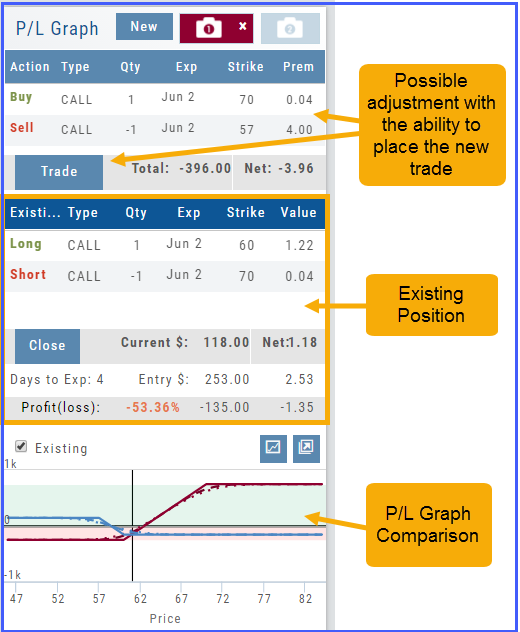
Trade Management
This platform makes it easy to manage and adjust trades when needed. The Snapshot feature and the P/L graph enables you to visually assess adjustments.
Once the existing trade is showing on the options page, take a ‘snapshot’. Enter the adjustment, then take another ‘snapshot’.
To submit the adjustment to the Order Ticket of your brokerage account, click “Trade”. The smart ticket system will even handle the trade adjustment automatically by entering the appropriate buy/sell, open/close combination. 
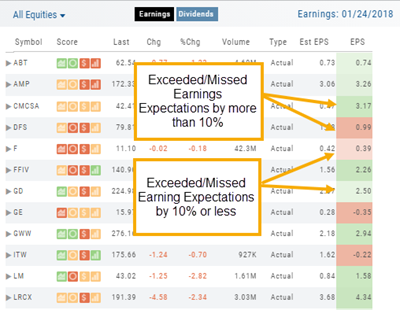
Earnings Per Share Performance
Once a date has past and earnings have been announced, Earning Per Share (EPS) is color-coded based on how much the company beat (or missed) Expectations.
Go to Find>Calendar, select “Earnings” and view any past date, where earning have been announce, to view the results.
Dark Green/Dark Red is considered surprise, and indicate the company beat/missed estimates by more than 10%
Light Green/Light Red indicate the company beat/missed estimates by 10% or less
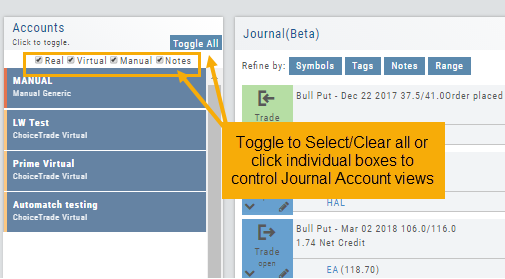
Journal Account Multi-Selector
Reviewing your Journal Accounts is made easier by using the Multi-Select tool on the Journal Tab. Control your Journal Account Views by selecting from Live, Virtual, Manual accounts or Notes or any combination of these.
Use the “Toggle All” button to switch or toggle your selection. Example: If you have your virtual selected and not your real accounts, Toggle will switch to real account and unselect virtual account. This can be a great way to analyze your results and compare real and virtual.
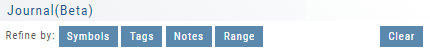
You can further sort by Symbol, Tags, Notes or Date Range within an Account by using the following tabs in the Journal:
NOTE: Any filtering, including account selection, will refine your analytics results too. Want to find your results from a specific account. Select just that account and analytics will refect accordingly.