Score Navigation
There’s more than one way to get the information you want.
Anywhere you see a Score Icon, you can navigate directly to the corresponding function of Technical Analysis, Inner Circle, Valuation, or Fundamental research – with a single click on the icon.
The Top 4 Categories
The names may be different, but the scans remain the same! 
Feature – Your favorite and our highlighted scans, including scans related to The Score.
Ideas – Scans for general ideas including Dividends, Money Flow, Volatility, Earnings and more.
Outlook – For Bearish, Bullish and Stagnant outlook conditions.
Strategy – Over 20 strategy-specific scans including Bull Put, Bear Call, Iron Condor and more.
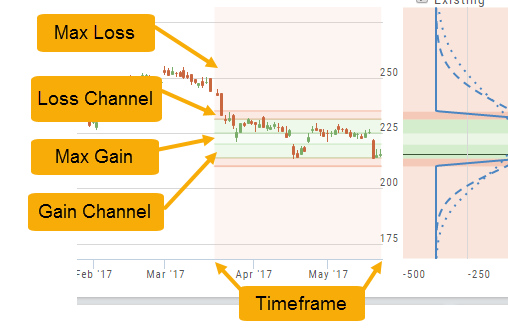
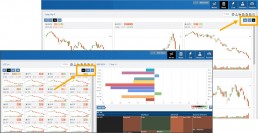
Performance Channels
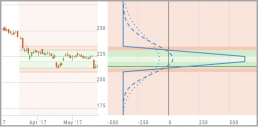
Performance Channels can assist in visual analysis across both the P/L Graph and the Chart.
- Dark Green – Stock movement affects gain
- Light Green – At maximum gain
- Dark Red – Stock movement affects loss
- Light Red – At maximum loss
The width of the channel on the chart represents the timeframe of the trade. If options expire in 30 days, the channel will display back 30 days on the chart. This give a visual reference for the time frame of the trade.
Note: Channels are displayed based on expiration of the trade. Past performance is not indicative of future results. Performance channel date orientation is for reference only.
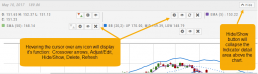
Icon Navigation
More than a picture, icons will help guide you through the trading process.
This graphic shows the function of some of the icons found in The Trade Tool.
Hint: Most icons will display a short description of its function or purpose by hovering the cursor over it.
![]()
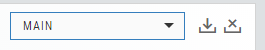
Chart Navigation
Hovering the cursor over the icons will display it’s function.
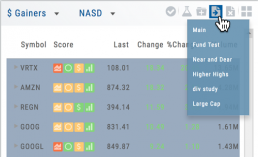
In the upper right of the Chart screen, you can select which Chart Profile to research from the drop-down box, then save or delete the profile.
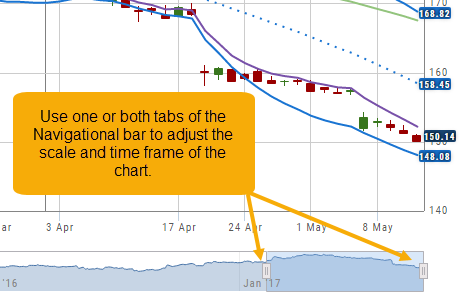
The next set of icons immediately below this gives more charting capabilities: Increase/Decrease price ranges, Reset price range, Hide/Show Navigation Bar, Move the date Back/Forward, Export/Print Chart
![]()
Other features include the Navigation Bar (below the chart). The shaded area corresponds to the chart time period. Slide one or both tabs of the bar to adjust the time period covered.
The “Hide/Show” button near the top-right of the screen will collapse the Indicator Detail area above the chart.
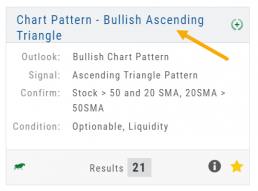
The Tile
The Scan Name and number of results are displayed on each Tile. Click on the ![]() on the upper right corner of the screen to display Scan Criteria.
on the upper right corner of the screen to display Scan Criteria.
Click on the name of the Scan Header to view results.
Use the toolbar icons on the results page to Research, send to a Watchlist, Filter, etc.
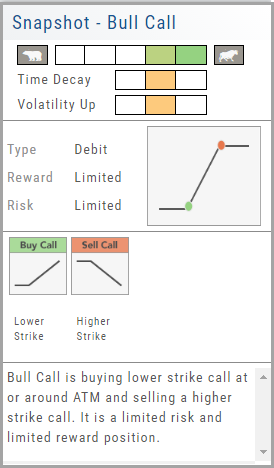
Strategy Snapshot
It’s the “Cliffnotes” version of your strategy
Each strategy template provides a quick reference for the construction and application of the strategy. The snapshot shows:
- what the strategy outlook is on the color-coded range from ‘Very Bearish’, ‘Mildly Bearish’, ‘Neutral’, ‘Mildly Bullish’ or ‘Very Bullish’.
- what effect ‘time decay’ and ‘volatility’ has on the strategy: ‘Increase’, ‘Neutral’ or ‘Decrease’.
- debit or credit trade
- risk & reward level
- strategy structure
- an overview summary of the strategy
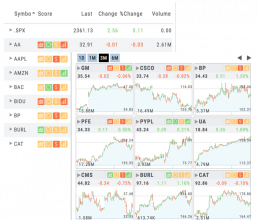
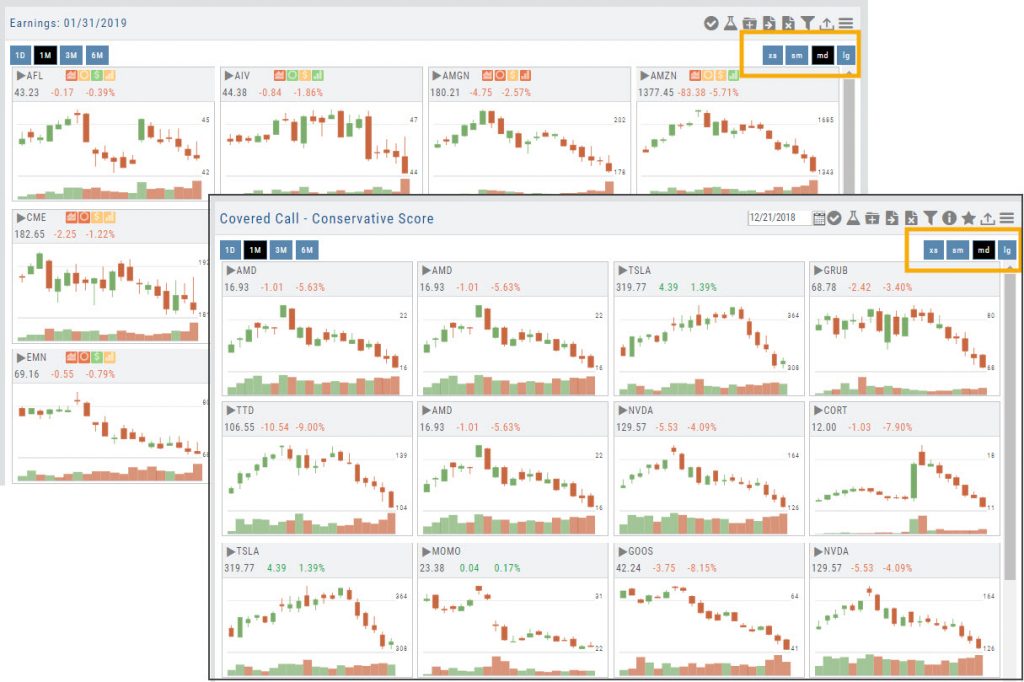
Tile View Sizes
Tile View is available in 3 sizes on the Market or Watch Tabs.
Scans and Earnings/Dividends Calendar under the Find tab offer 4 Tile View sizes: Extra Small to Large.
The platform’s adaptive and responsive technology will automatically adjust the number of tiles shown based upon the available space as well as allow continual scrolling for large lists.
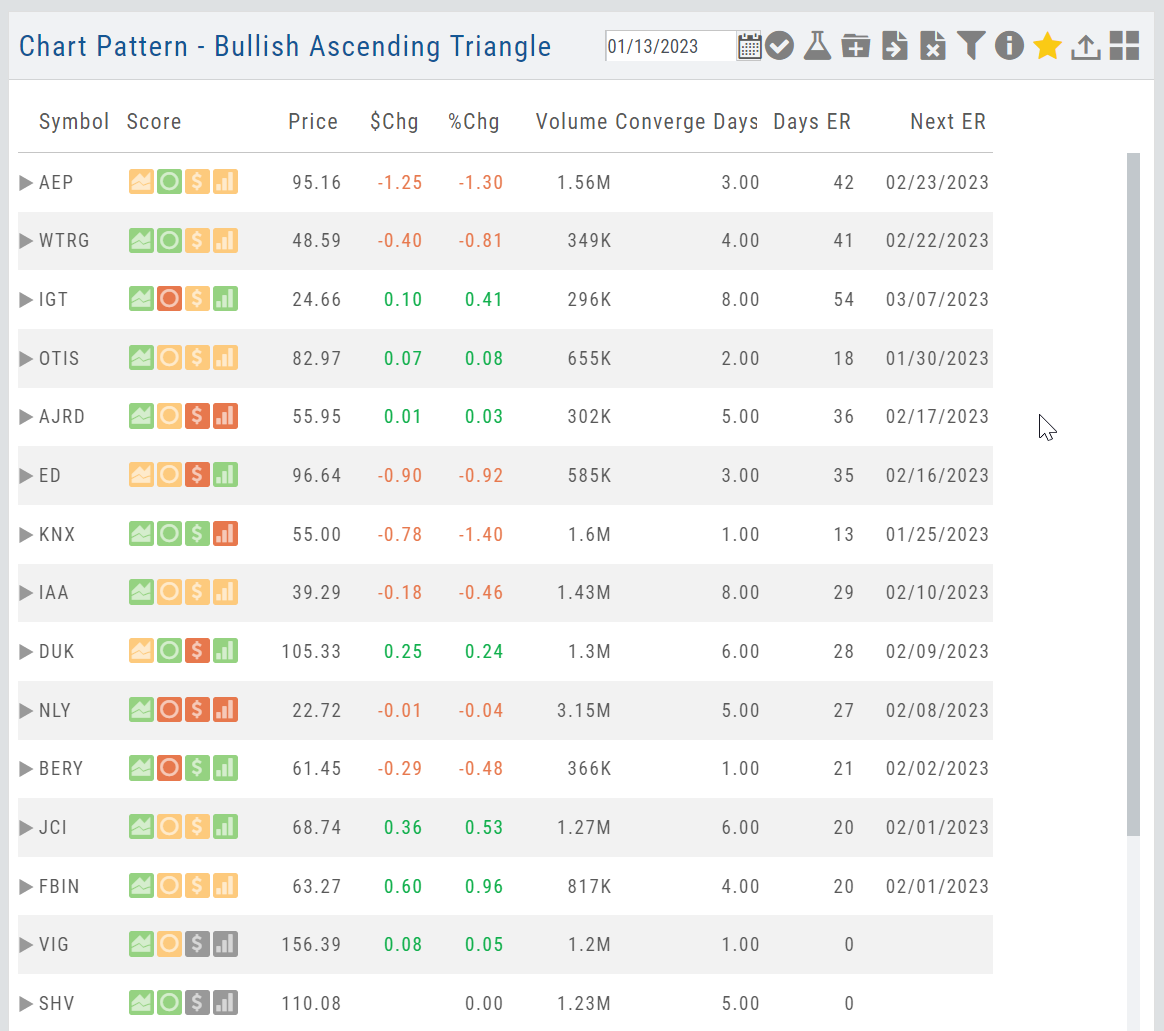
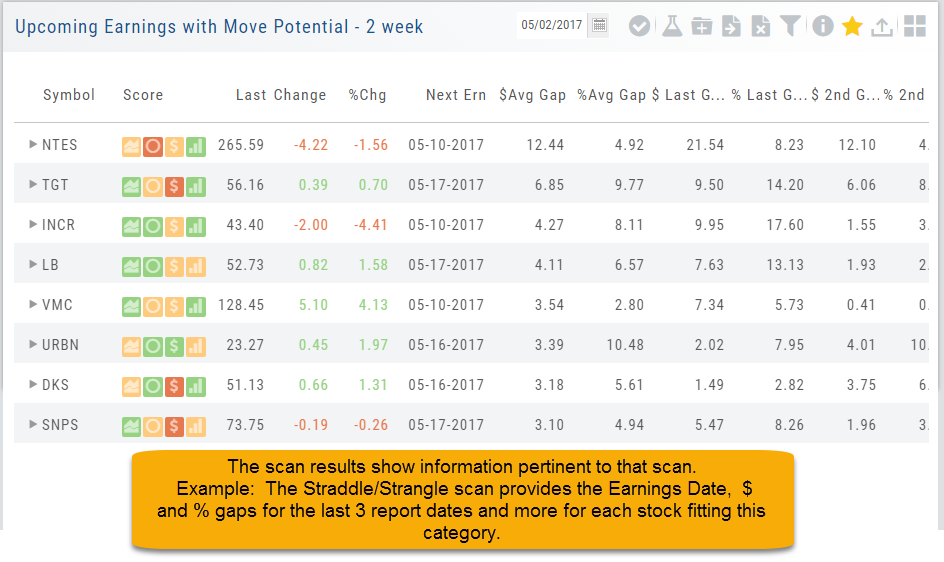
Dynamic Scan Information
The scan results provide relevant information for that scan. For example: Dividends will show Yield, Covered Calls will show the options position, potential return, net cost and more.
This allows you to quickly pick stock candidates and bypass others for high-probability trades. For example, you may wish to eliminate stocks priced too high or low, those with low volume, etc. Use the Navigational tools (Action Icon, The Score Icon, Send to Watchlist or Research for example) to dive deeper in selecting the best stock.
Filter Scan Icon
The Filter icon ![]() – located in the upper left area of the scan page – allows you to narrow candidates of an initial scan by applying additional parameters.
– located in the upper left area of the scan page – allows you to narrow candidates of an initial scan by applying additional parameters.
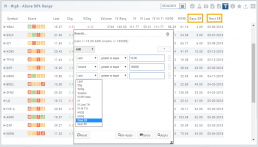
You can adjust the criteria at any time to further narrow or increase the number of results by eliminating, adding or adjusting entries.
This Smart Search feature filters data unique to the scan. Ex: Covered Calls Filtering offers Net Entry Cost, $ Return with no Movement, $ Return if Called out, etc.
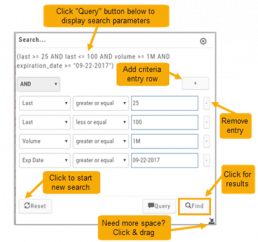
Use drop-down box to select parameters and enter criteria in boxes.
Add rows if needed by clicking on ‘+’
If you need more space, click and drag the arrow in the bottom, right corner.
Click “Find”.
Click ‘Reset’ to start over. The “Query” button displays the criteria at the top of the Filter page. Click again to remove.
Give it a try!