Hovering the cursor over the icons will display it’s function.
In the upper right of the Chart screen, you can select which Chart Profile to research from the drop-down box, then save or delete the profile.

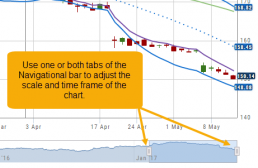
The next set of icons immediately below this gives more charting capabilities: Increase/Decrease price ranges, Reset price range, Hide/Show Navigation Bar, Move the date Back/Forward, Export/Print Chart
![]()

