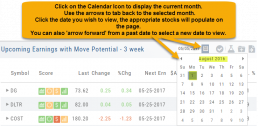
Past Scan Results
When viewing scan results, you can select a past date by clicking on the Calendar Icon, then the back arrow until you get to the month you want to search from. Click on the date you wish to view & the appropriate stocks will populate the screen.
The date you are searching will be displayed in the header
Note: Past Scans availability dates vary. When a new scan is added, the history is available from the day it was added to the platform going forward.
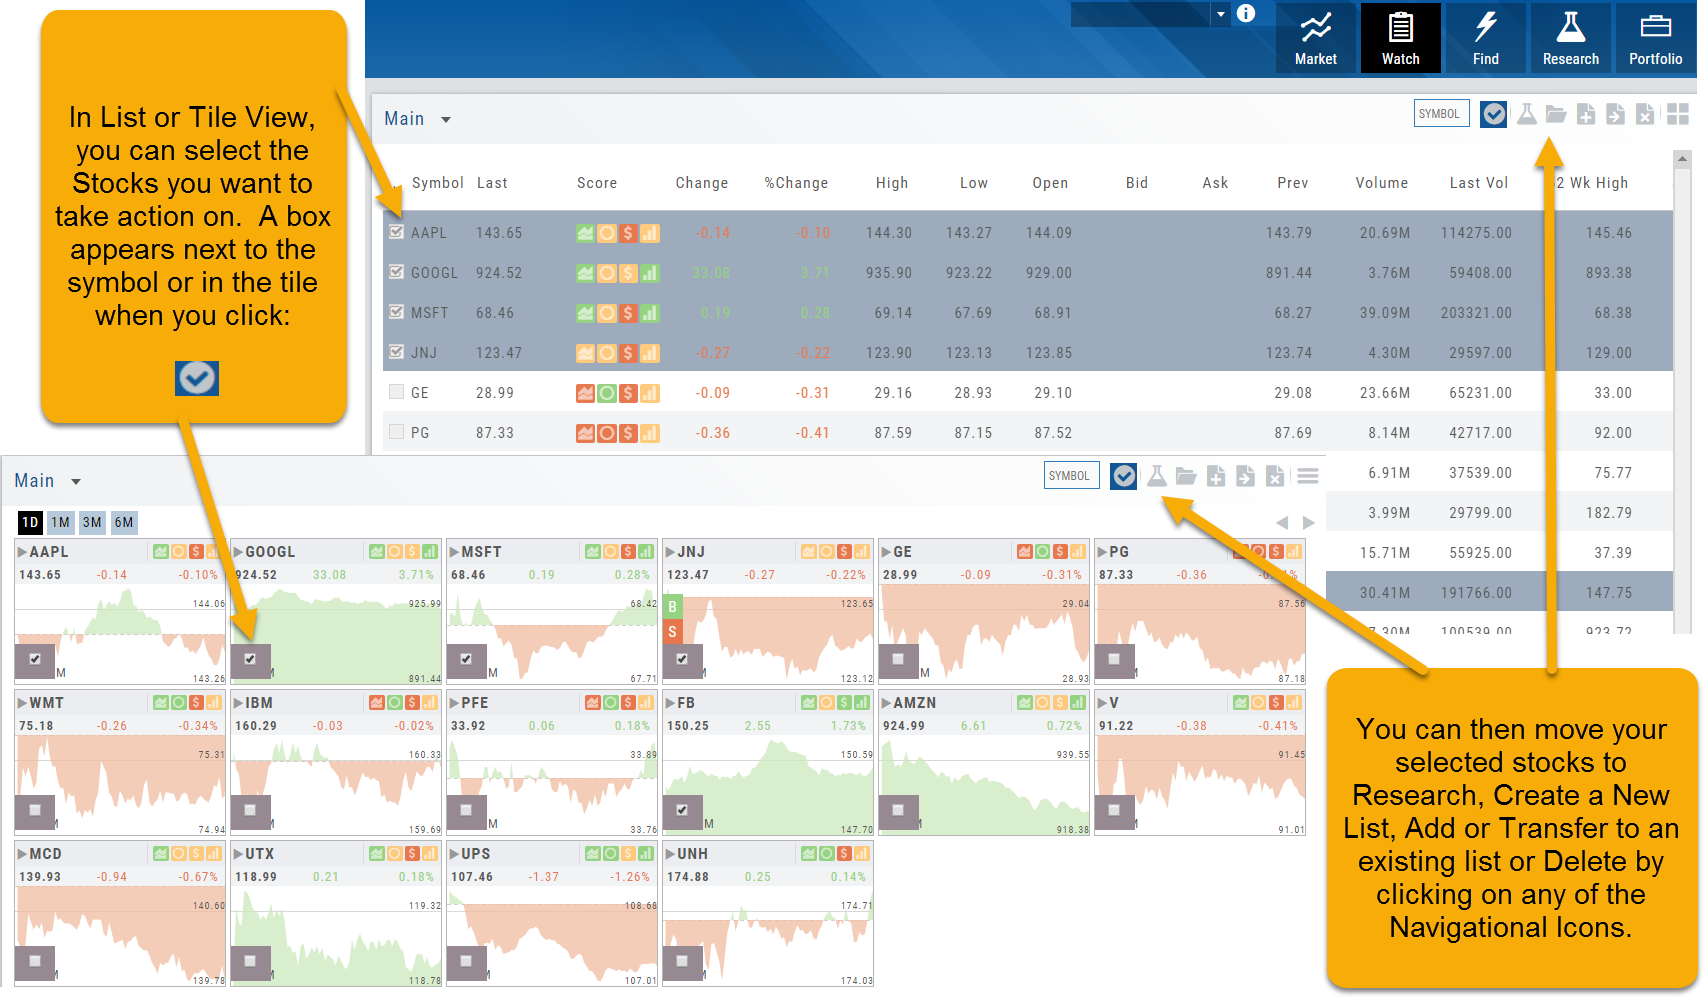
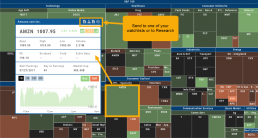
Multi-Select Stocks
Multi-select lets you choose a group of stocks. Once selected you can go to research, send to another list, create a new one, or delete from the list. This feature is also available in “Tile View”
You can also multi select using click/drag or control click in the List View.
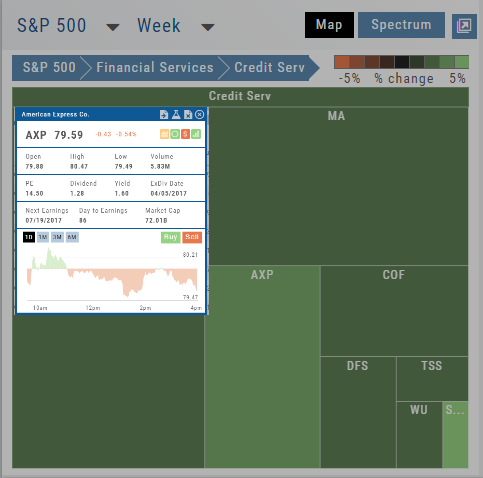
Heat Map & Spectrum Overview
Broad Market Insight that allows you to drill down
The Heat Maps are accessible in the Market tab and under Find>Explore and provide powerful visual views of market performance. This feature is designed to adapt to a variety of strategies and outlooks according to your portfolio needs. Select Index and Time Frame using the Action Icons. These can be changed going forward in any map screen.
In the Map view, each box represents either an industry group (default) or a stock when you drill down. The size of the box represents the market cap. By hovering your cursor over each box, an info box appears with info on that group within that industry, including the the number of companies, Market Cap, % Change in selected time frame.
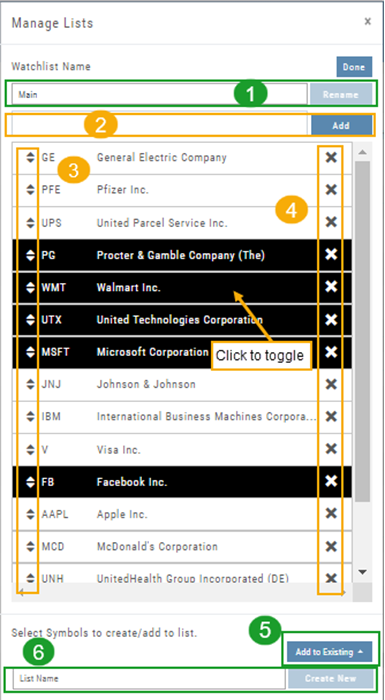
Manage/Modify Watchlists
The Modify feature offers the following Symbol and List Management capabilities in one location:
- Rename the current Watchlist
- Add Symbols to the current Watchlist
- Use up/down arrows to drag/rearrange symbols in selected List
- Remove symbol(s) by clicking on ‘X’
- Highlight symbol(s) to add to another Existing Watchlist
- Highlight symbol(s) to Create a New Watchlist
Bonus! You can keep your Watchlist sorted by any heading using this feature:
Select your Watchlist
Sort by any Heading (Example: Price – High to Low)
Click on the Manage Icon, then click “Done” at the top of the screen
This setting will be ‘sticky’ until you change it.
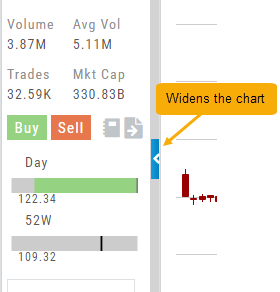
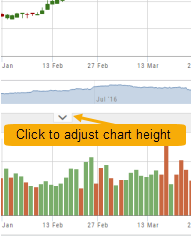
Adjust Chart Height & Width
The height of the chart can be adjusted by clicking and dragging the tab under the main chart.
This is a feature unique per device. You can have separate settings for your laptop/desktop,notebook or even tablet.
To widen the chart, click the blue tab on the left side of the chart. This will collapse the Quote Bar to the left of the chart. You can ‘undo’ this by clicking the tab again.
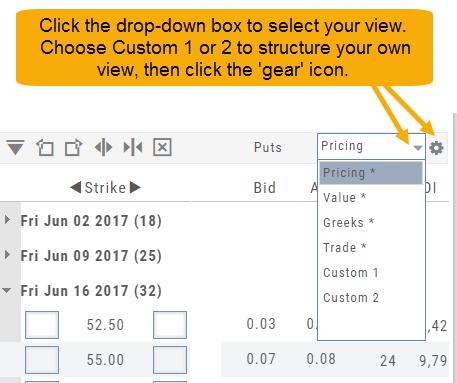
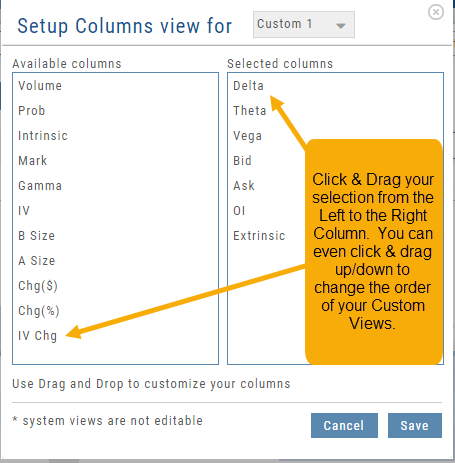
Create Customized Option Table Views
Create, edit and re-create custom Option Views.
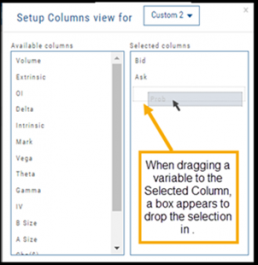
This feature allows you to create up to two customized Option Tables. Add/remove categories or even change the order of category columns by clicking on the criteria, then drag/drop it to the new location.
Click ‘save’ and you’re done.
Note: You can change the order of your variables you select by clicking/dragging the variable up or down. The custom views can be changed at any time – to adjust to the user’s needs.
Heat Maps Too
The Heat Maps on the Market page offer the ability to drill down to the stock level. You are able to do this with both the Map and Spectrum views. Clicking on a stock will also show the quote detail. From this you can also send to a list or research.
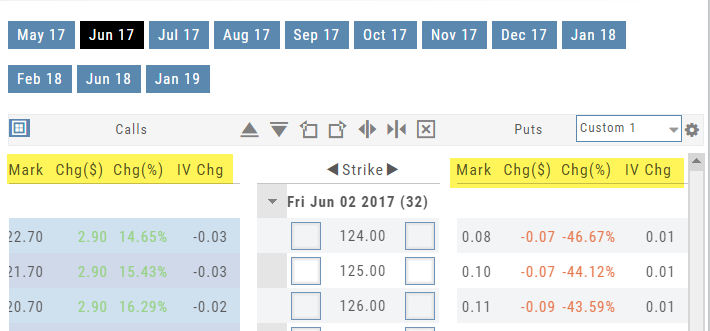
Additional Option Criteria
More Option Choices for Customized Option Tables
Mark: The mid-point price between the option’s Bid and Ask
$ Change
% Change
IV Change
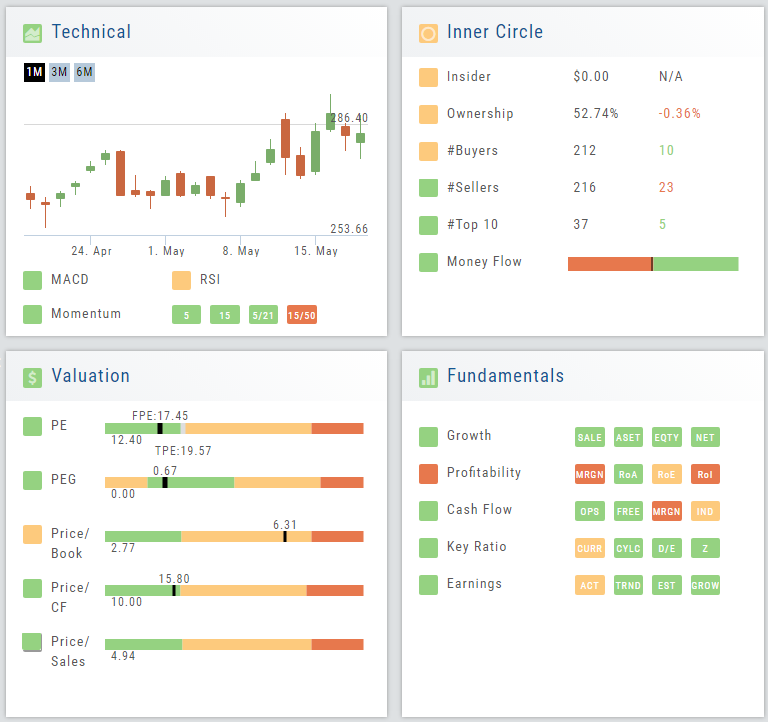
Valuation
Is it Overvalued or Undervalued?
Valuation looks at Key Ratios and Projected Price to evaluate the stock’s current value.
Key Ratios like both trailing and forward PE along with PEG (Price/Earnings/Growth) are weighed.
The Price compared to Book (flow of business), Cash Flow, and Sales are also very important factors to provide a well-rounded synopsis of the valuation modeling of the stock.
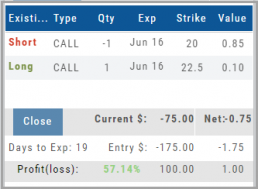
Evaluate Existing Positions
Positions will automatically show on the options chain for the active brokerage account.
You can also access directly from Broker Positions. Select “Analyze” from the Action menu. 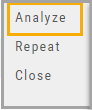
This will display the current values as well as entry cost and current P/L.
Here you can also close the position or evaluate adjustments on the trade.