Chart Navigation
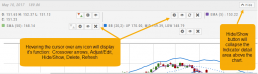
Hovering the cursor over the icons will display it’s function.
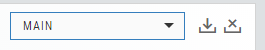
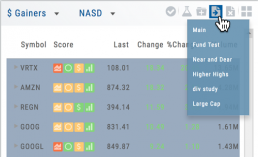
In the upper right of the Chart screen, you can select which Chart Profile to research from the drop-down box, then save or delete the profile.
The next set of icons immediately below this gives more charting capabilities: Increase/Decrease price ranges, Reset price range, Hide/Show Navigation Bar, Move the date Back/Forward, Export/Print Chart
![]()
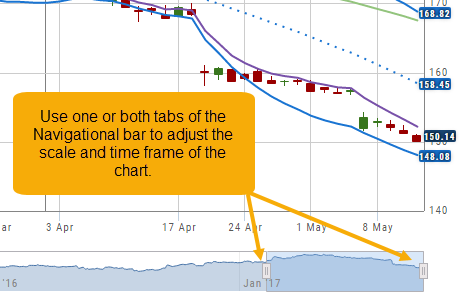
Other features include the Navigation Bar (below the chart). The shaded area corresponds to the chart time period. Slide one or both tabs of the bar to adjust the time period covered.
The “Hide/Show” button near the top-right of the screen will collapse the Indicator Detail area above the chart.
Smart Action Icon
The Smart Action Icon ![]() adjusts available features depending upon where you are in the trading platform.
adjusts available features depending upon where you are in the trading platform.
For Stocks you can ‘Buy’, ‘Sell’, view ‘Options’, etc. 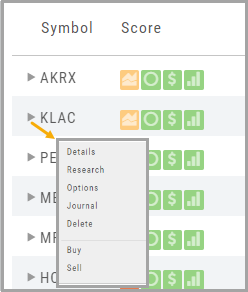
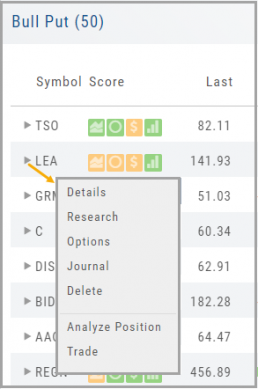
Any Strategy-specific options scan will have ‘Analyze’ and ‘Trade’ in the Action Icon Menu. You can click ‘Analyze’ to see the trade in the options chain. From there, you can Edit the structure or click ‘Trade’ to submit the trade to your to Brokerage Account and Journal.
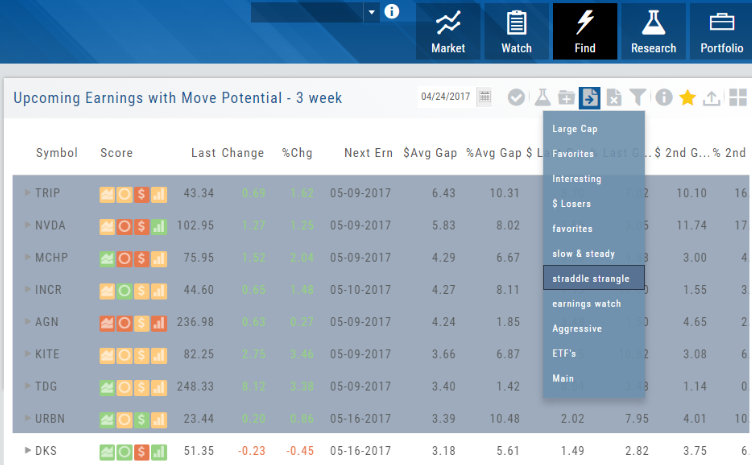
Sending from One “List” to Another
You can send symbols from any list, including Find, Explore, Actives, to your Watch lists — including from one watch list to another.
Simply (1) click the “Check” icon, (2) select the symbol(s), (3) click the “Page/Arrow” icon and select the List you want the selections sent to.
You can also ‘Click & Drag’ – highlighting a group of symbols you want moved to another list, or to the Research Tab.
Note: Research can handle up to 20 stock symbols at a time.
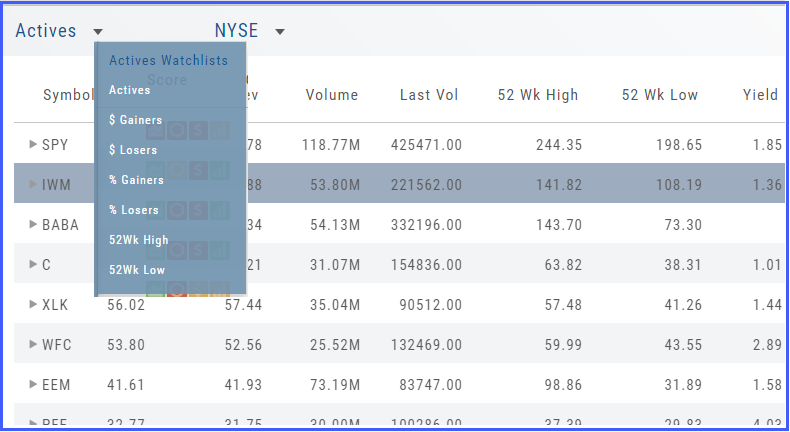
The Other Lists
In addition to your Personal and Dynamic Watch lists, the platform also provides “Actives Watch lists” from which you can add results to a new or existing Watch list.
If you want to eliminate low price, low volume stocks, click on the appropriate header to sort, then you can either click/drag to highlight the ones you want to delete – or – click the Check icon from the navigational icons to select the ones to delete – or to send to Research or another Watch List. ![]()
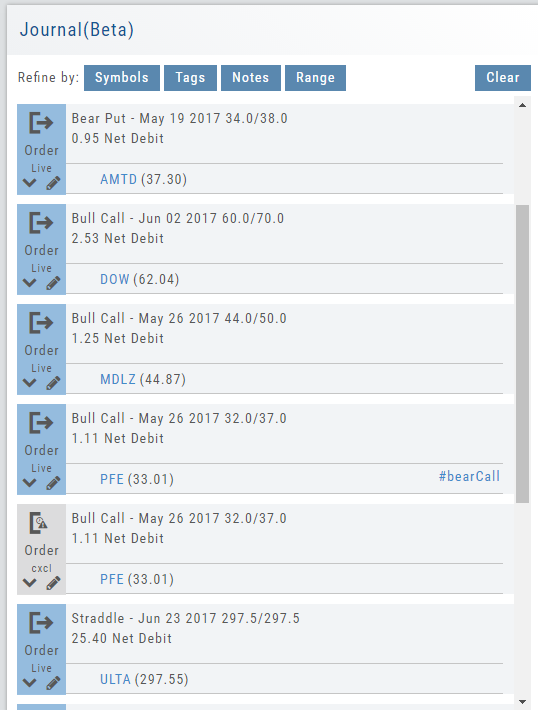
Journal Navigation
![]()
It’s easy to look up trades. Choose from Stock symbols, tags used (ex: #bullCall, #longStraddle), Notes containing certain words or phrases, or date ranges from 1 Day to 1 Year.
On the individual Trade tabs, click the ![]() icon to expand the trade detail. To edit/add tags, notes, to the trade entry, click
icon to expand the trade detail. To edit/add tags, notes, to the trade entry, click ![]() then ‘save’ when completed.
then ‘save’ when completed.
Once the Trade Tab is expanding , you have additional options: The “Replay” icon, ![]() , sends a trade from the Journal to Backtest Analysis. You can delete a Journal Entry by clicking on
, sends a trade from the Journal to Backtest Analysis. You can delete a Journal Entry by clicking on ![]() .
.
Rolling Positions
It’s easier & faster to evaluate your Trade
Once you have entered a position, you can easily make adjustments for further evaluation using the group of Rolling Icons in the upper-center part of the Option Table.
These icons will allow you to move the whole position: 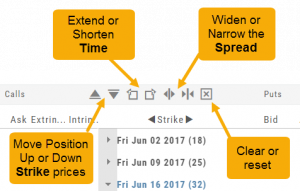
Up or Down Strike Prices
Extend or Shorten Time
Widen or Narrow the Spread
The [X] acts as a clear function. Clicking once will clear the current positions in the chain. Clicking a second time will act as “all clear”. This will clear any snapshot trades and fully reset the option chain.
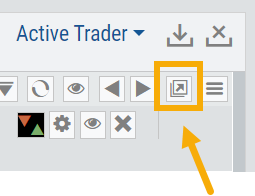
Go Big - Graphs & Charts
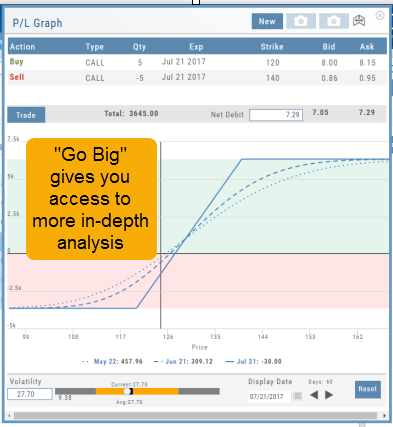
Anywhere you see the ‘Go Big’ icon ![]() , you can expand the graphic and access additional information.
, you can expand the graphic and access additional information.
The Chart Tab under Research has such a button in the icon toolbar as shown:
The Heat Map on the Market Tab will allow you to filter criteria such as stock price, volume, market cap, etc. 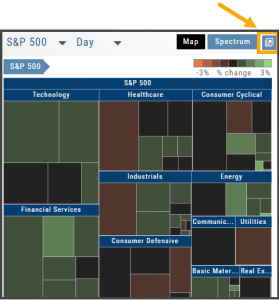
In the Options Tab, you can do this with the P/L Graph and the Volatility Chart. The icon is located at or near the upper right of the graph or chart.
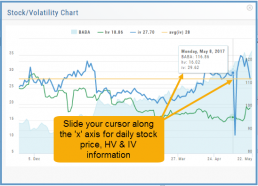
Expanding the Stock/Volatility Chart allows you to view past Historic Volatility, Intrinsic Volatility and stock price on a day-to-day basis.
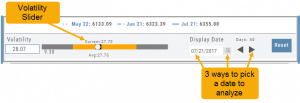
For deeper Trade Analysis, use the Volatility Slider tool and the Date Picker, located at the bottom of the P&L Graph:
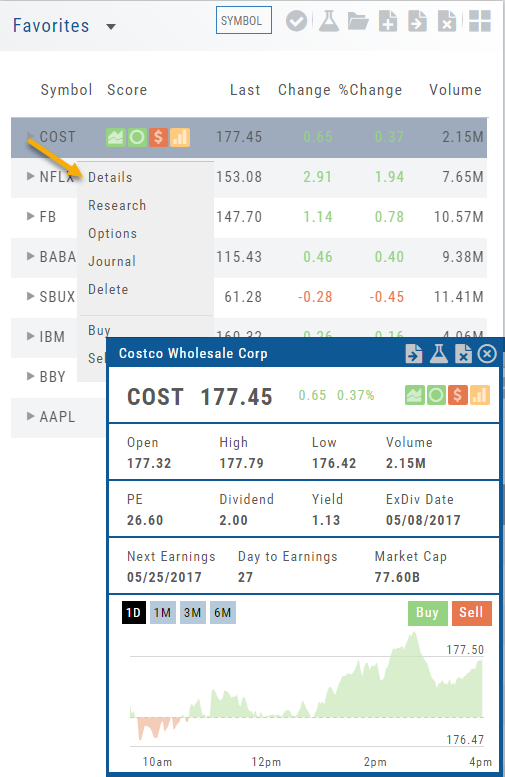
Quote Detail without leaving the List
A quick snapshot of a stock with navigational tools.
The Action Arrow Icon will provide a pop-up Quote Detail window including the current price, trading volume, Dividend Date -if applicable, Earnings Date and more. A chart, on the bottom part of the Detail Box, allows for difference periodices: 1 Day, 1,3 or 6 Months.
Notice the additional icons in the Quote Detail: You can send this stock to one of your Watch Lists, to Research or delete the stock if you wish. The Score Icons will direct you to the appropriate Research function. Buy/Sell buttons allow for quick order placing.