The Top 4 Categories
The names may be different, but the scans remain the same! 
Feature – Your favorite and our highlighted scans, including scans related to The Score.
Ideas – Scans for general ideas including Dividends, Money Flow, Volatility, Earnings and more.
Outlook – For Bearish, Bullish and Stagnant outlook conditions.
Strategy – Over 20 strategy-specific scans including Bull Put, Bear Call, Iron Condor and more.
Technical Analysis
Technicals: The fastest indicators of The Score
In Technical Score, 3 primary categories of studies are evaluated – MACD, RSI, and Momentum.
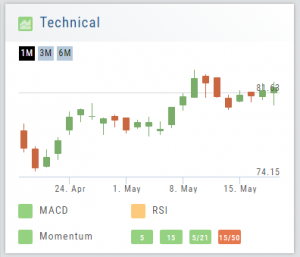
Momentum is made up of 4 different trend analysis timelines.
5 = Stock over the 5-day moving average
15 = Stock over the 15-day moving average
5/21 = 5-day moving average over the 21-day moving average
15/50 = 15-day moving average over the 50 day moving average
Note: Momentum indication is from fastest to slowest. This can be helpful in determining your time frame/outlook for the appropriate strategies.
By clicking on the Technical Score Icon anywhere in the platform, you’ll be taken to the Chart Tab under Research for that Company/Symbol.
Go to Charts for more in-depth information.
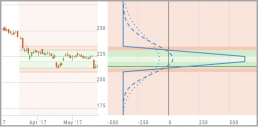
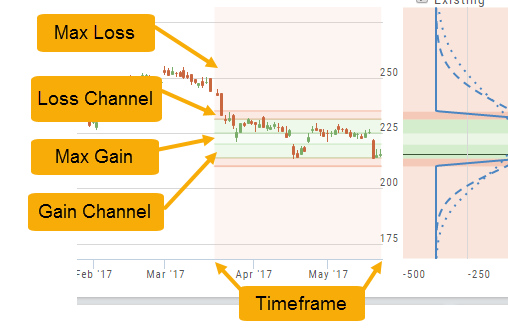
Performance Channels
Performance Channels can assist in visual analysis across both the P/L Graph and the Chart.
- Dark Green – Stock movement affects gain
- Light Green – At maximum gain
- Dark Red – Stock movement affects loss
- Light Red – At maximum loss
The width of the channel on the chart represents the timeframe of the trade. If options expire in 30 days, the channel will display back 30 days on the chart. This give a visual reference for the time frame of the trade.
Note: Channels are displayed based on expiration of the trade. Past performance is not indicative of future results. Performance channel date orientation is for reference only.
Earnings, Dividends and more...
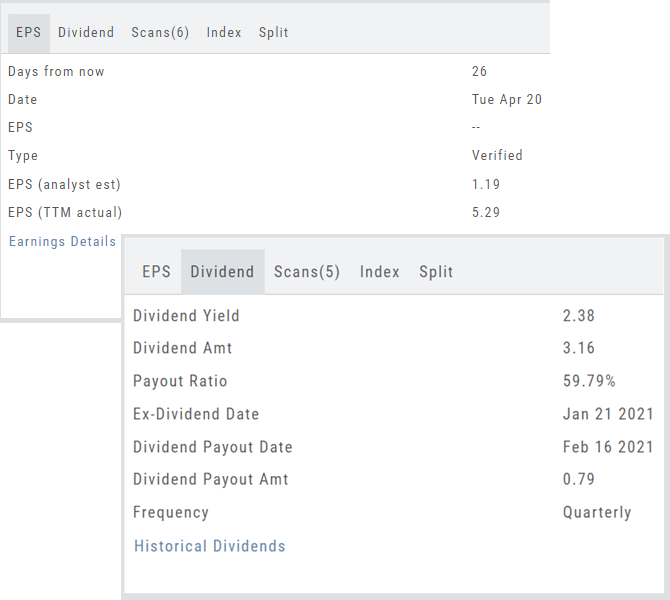
The far right, lower box in Research provides the following:
Earnings Tab: Get Earnings date, number of business days until announcement, Estimated and Actual Trailing Twelve Months (TTM) EPS, and link to the prior 12 Quarter Earnings details.
Dividend Tab: Get Yield, Amount, Payout Ratio (dividend/EPS), the Ex-Dividend Date (deadline to complete a stock purchase to be entitled to dividends), Payout information, Frequency and link to the prior 12 Quarter Dividends.
Scans Tab: Quickly view how many & which scans the stock symbol appears on.
Index Tab: Lists the symbol and indices name(s) on which this stock appears.
Split Date: Provides most recent Split Date, Detail and a link to view Split History
Icon Navigation
More than a picture, icons will help guide you through the trading process.
This graphic shows the function of some of the icons found in The Trade Tool.
Hint: Most icons will display a short description of its function or purpose by hovering the cursor over it.
![]()
Chart Navigation
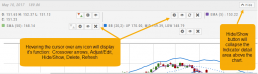
Hovering the cursor over the icons will display it’s function.
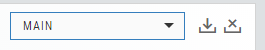
In the upper right of the Chart screen, you can select which Chart Profile to research from the drop-down box, then save or delete the profile.
The next set of icons immediately below this gives more charting capabilities: Increase/Decrease price ranges, Reset price range, Hide/Show Navigation Bar, Move the date Back/Forward, Export/Print Chart
![]()
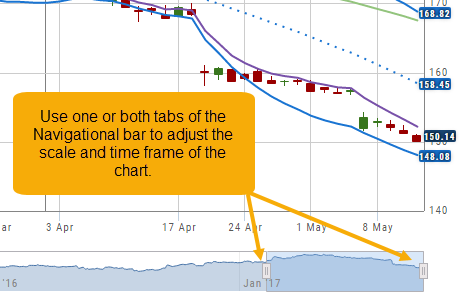
Other features include the Navigation Bar (below the chart). The shaded area corresponds to the chart time period. Slide one or both tabs of the bar to adjust the time period covered.
The “Hide/Show” button near the top-right of the screen will collapse the Indicator Detail area above the chart.
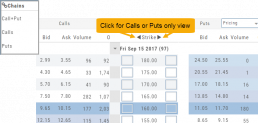
Chain Views
Different views are available for options such as Calls + Puts, Calls only or Puts only. Select from the drop-down box or toggle the screen using the arrows ![]() in the chain header.
in the chain header.
In addition, there are over 20 strategy templates on the Options tab.
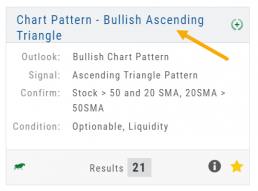
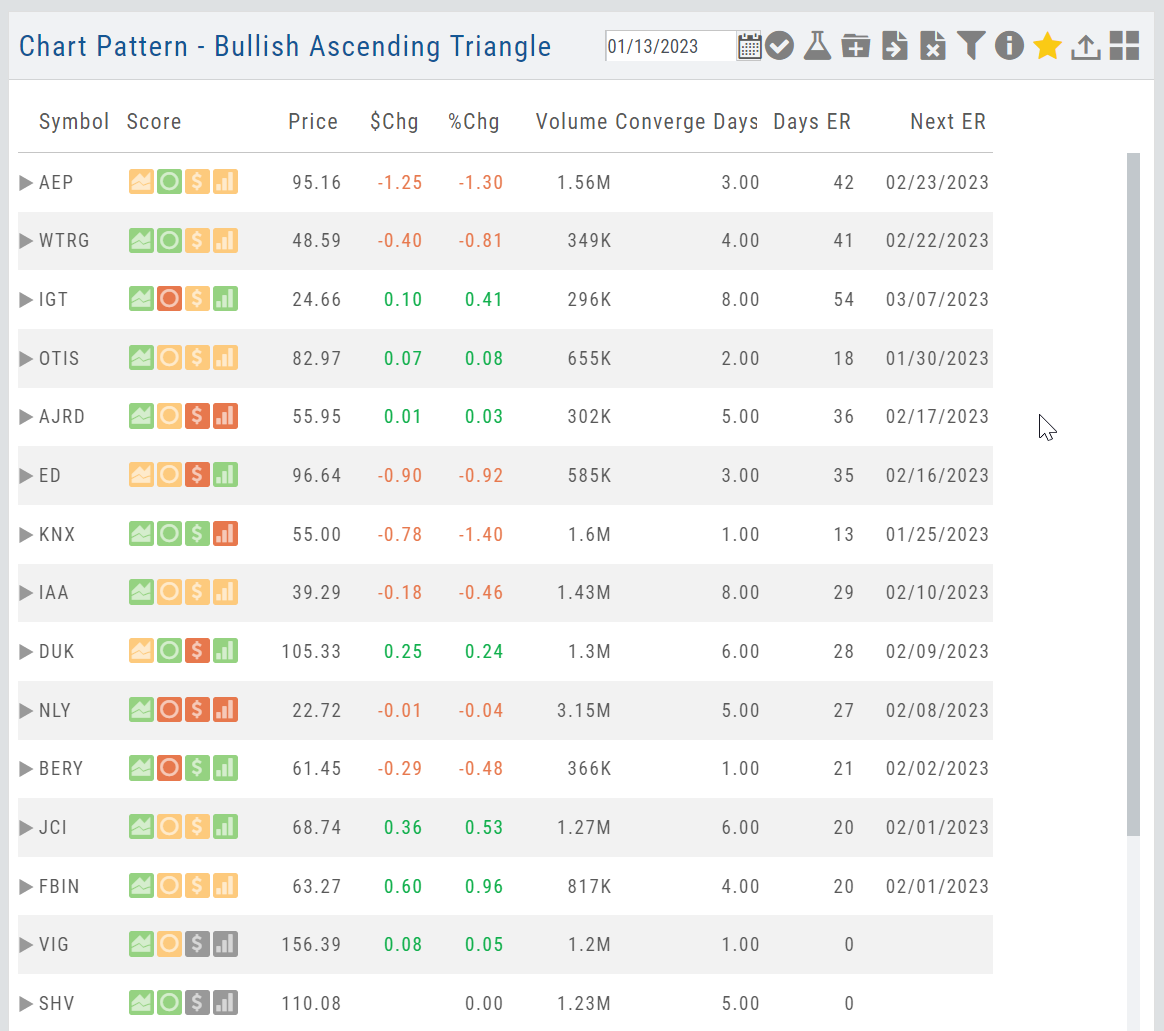
The Tile
The Scan Name and number of results are displayed on each Tile. Click on the ![]() on the upper right corner of the screen to display Scan Criteria.
on the upper right corner of the screen to display Scan Criteria.
Click on the name of the Scan Header to view results.
Use the toolbar icons on the results page to Research, send to a Watchlist, Filter, etc.
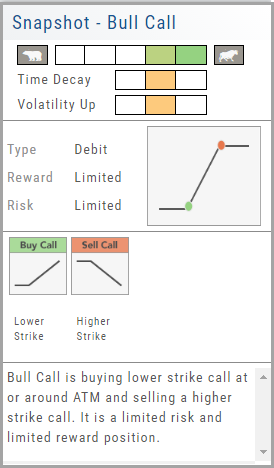
Strategy Snapshot
It’s the “Cliffnotes” version of your strategy
Each strategy template provides a quick reference for the construction and application of the strategy. The snapshot shows:
- what the strategy outlook is on the color-coded range from ‘Very Bearish’, ‘Mildly Bearish’, ‘Neutral’, ‘Mildly Bullish’ or ‘Very Bullish’.
- what effect ‘time decay’ and ‘volatility’ has on the strategy: ‘Increase’, ‘Neutral’ or ‘Decrease’.
- debit or credit trade
- risk & reward level
- strategy structure
- an overview summary of the strategy
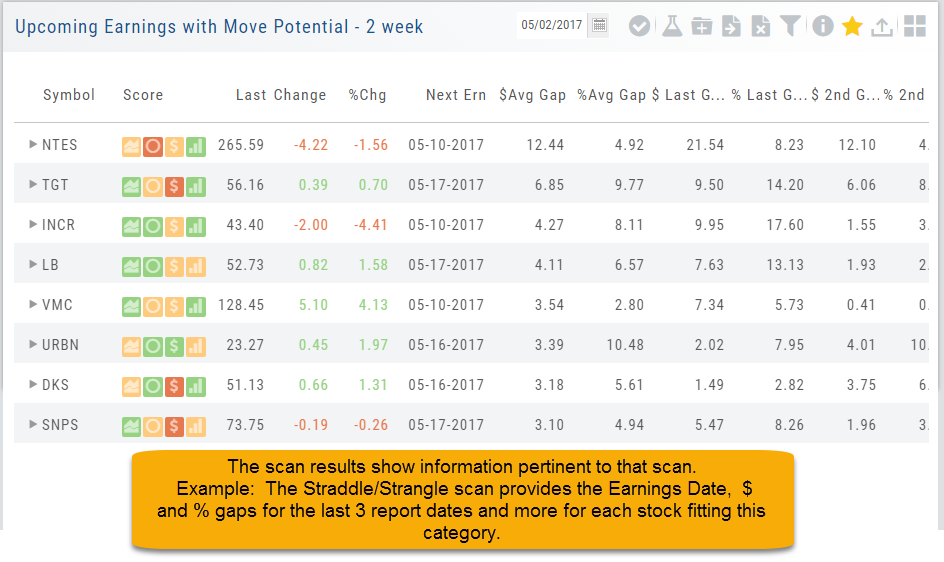
Dynamic Scan Information
The scan results provide relevant information for that scan. For example: Dividends will show Yield, Covered Calls will show the options position, potential return, net cost and more.
This allows you to quickly pick stock candidates and bypass others for high-probability trades. For example, you may wish to eliminate stocks priced too high or low, those with low volume, etc. Use the Navigational tools (Action Icon, The Score Icon, Send to Watchlist or Research for example) to dive deeper in selecting the best stock.