Filter Scan Icon
The Filter icon ![]() – located in the upper left area of the scan page – allows you to narrow candidates of an initial scan by applying additional parameters.
– located in the upper left area of the scan page – allows you to narrow candidates of an initial scan by applying additional parameters.
You can adjust the criteria at any time to further narrow or increase the number of results by eliminating, adding or adjusting entries.
This Smart Search feature filters data unique to the scan. Ex: Covered Calls Filtering offers Net Entry Cost, $ Return with no Movement, $ Return if Called out, etc.
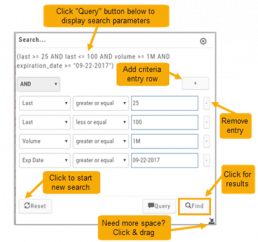
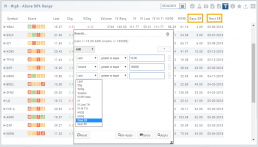
Use drop-down box to select parameters and enter criteria in boxes.
Add rows if needed by clicking on ‘+’
If you need more space, click and drag the arrow in the bottom, right corner.
Click “Find”.
Click ‘Reset’ to start over. The “Query” button displays the criteria at the top of the Filter page. Click again to remove.
Give it a try!
Option Tables & Templates
Expanding your Options!
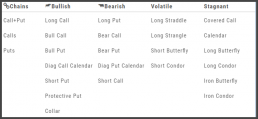
Choose from Call+Put chains, Call Matrix, Put Matrix or from almost 2 dozen Option Templates – covering any market outlook.
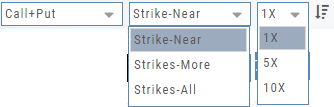
Expand the Strikes displayed: Near ATM, More or All.
You can change the click Quantity default increment by changing the default parameter for 1x, 5x or 10x.
You can also sort the Strike prices: Lowest to Highest, or vice-versa.
Smart Action Icon
The Smart Action Icon ![]() adjusts available features depending upon where you are in the trading platform.
adjusts available features depending upon where you are in the trading platform.
For Stocks you can ‘Buy’, ‘Sell’, view ‘Options’, etc. 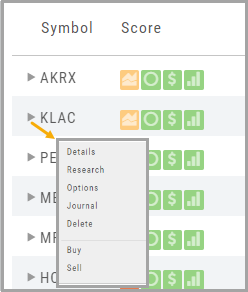
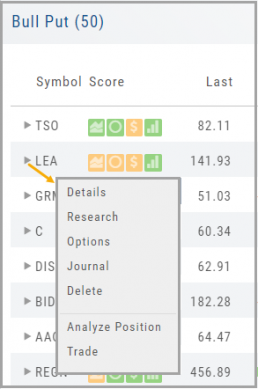
Any Strategy-specific options scan will have ‘Analyze’ and ‘Trade’ in the Action Icon Menu. You can click ‘Analyze’ to see the trade in the options chain. From there, you can Edit the structure or click ‘Trade’ to submit the trade to your to Brokerage Account and Journal.
Advanced Analytics
Some strategies are more responsive to time decay and/or volatility than others. This platform has tools to help analyze these components.
- Construct the position in the Option Chain table
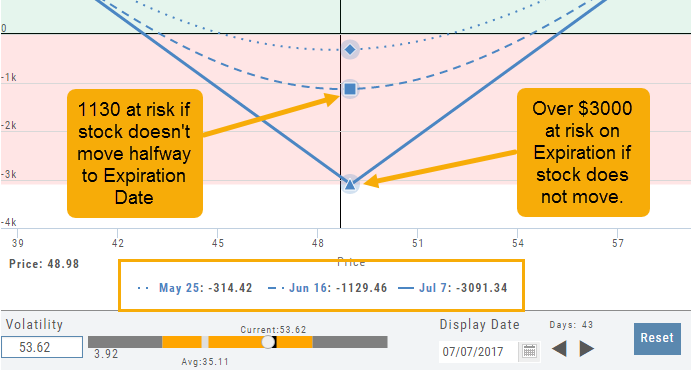
- Select the ‘Go Big’ icon on the P&L Graph
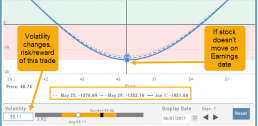
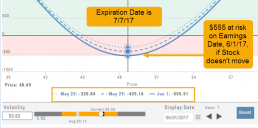
- The Graph shows 3 data points: Current Day, Halfway point to Expiration Day & Expiration Day. The corresponding legend, immediately below the graph, follows the cursor slider along the graph.
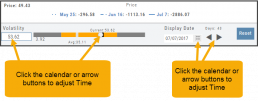
- The bottom of the screen contains a Calendar (Time) & Volatility Scale. Both can be manipulated to analyze the position.
Time: You can select a date to analyze as well as user stepper buttons to move day by day backward or forward.
Volatility: Use the volatility slider or enter a value in the entry box to see the impact of changes in volatility. The slider bar also displays the current (circle), average (gray), and 1 year high / low of implied volatility (orange portion of the slider) for easy reference.
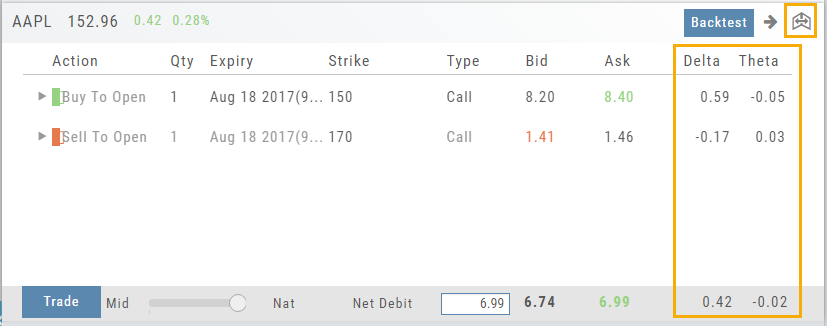
Delta & Theta Display on Template
You can expand the template to show Delta and Theta for the individual legs as well as the totals for the trade by clicking the ![]() icon on the upper right part of this screen.
icon on the upper right part of this screen.
This can help for faster evaluation and better positioning of the trade.
Heat Map & Spectrum Overview
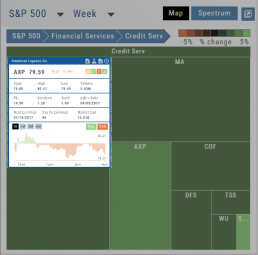
For Example: Clicking on “Financial Services” industry portion on the map of the S&P 500, then “Credit Services” will yield another map of 8 companies: Visa, Mastercard, American Express, etc. Clicking on any of those boxes will display the Stock info at a glance. Notice the Navigation Icons such at The Score as well as those to add to a Watchlist or send to Research.
The “Spectrum” View maps the sectors within the Index, with the number of companies in (parenthesis) by the performance by the time-frame selected. You can drill-down by selecting the sector group, then industry and company.
Note: By selecting the “Go Big” Icon, ![]() , in the upper-right corner of the corner of the panel, expands the amount of information and navigational icons.
, in the upper-right corner of the corner of the panel, expands the amount of information and navigational icons.
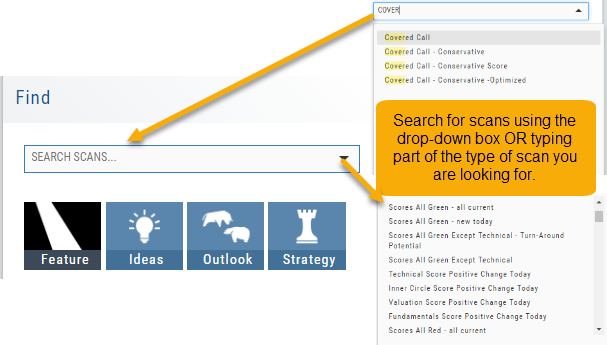
Scan - Smart search
The search box is found at the top of Find. It performs ‘smart searches’ by pulling all scans related to what is typed in. If you don’t know the name of the specific scan, but know it is related to Earning announcements, type “earning” and a list will populate showing scans that are about Earning. Typing “Bull” or “Bear” will bring up scans with “Bull or Bullish” or “Bear or Bearish” in their names, respectively.
Of course, you can also elect to search by clicking the arrow for a complete list of available scans in a drop-down search.
Don't Know the Symbol?
No Problem
You can search for symbols from several entry points including “Market” and “Watch”. Simply start typing all or part of the Company’s name and the system will proactively provide you with suggestions. You can use this feature anywhere including Insiders and Institutions.
For example, typing “Bank” in the Symbol box will bring up the stock symbols and names of companies with “bank” in their name.
Depending where you are in the Platform, clicking on the selected symbol while you are in:
The “Market” or “Watch” tab, it will be added to your currently open list of stocks.
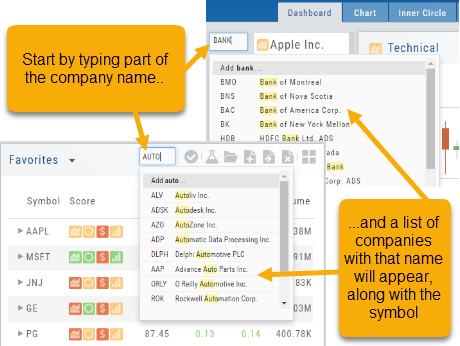
The Dashboard of the “Research” Tab, it will automatically provide the top layer of information on the stock. As always, you are able to navigate to different areas or ‘drill down’.
Insider or Institutions of the “Research” Tab, the corresponding data will display, such as data by Quarter, the biggest buyers and sellers and more.
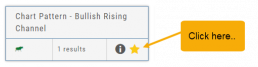
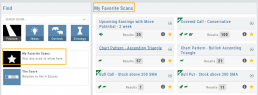
Save your Favorite Scans
Create your Customized Scan List
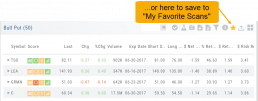
Star any scan to have it show in Feature > My Favorite Scans.
There are two ways to do this:
Simply click the star ![]() on the Tile View of the scans or on the header in the results view of any scan.
on the Tile View of the scans or on the header in the results view of any scan.
Favorites will be easily access from the Scan main page
Inner Circle - Behind the Scenes
Insider and Institutional Activity.
Insiders’ and Institutions’ activities in a stock is a powerful tool.
Insiders: Our proprietary Insider Score looks at who the insiders are, how many there are, and how much stock is being bought or sold to derive a score algorithm.
Institutions: We monitor overall and individual institutions’ activities around a stock with historical comparison to evaluate the Institution Score. 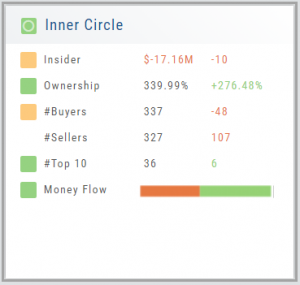
You have the ability to delve into as much information as you want by clicking on the ‘Detail’ box in “Insider Score” and “Institutions”. Find top buyers/sellers by week, month, 3 months, or one year. Search Institution Ownership by selected Quarter Report, newly added, reduced, current, top holders, etc. Dive deeper to gain insight into Institutions’ other holdings.
The information is easily accessible when you want it – just by the click of an icon, drop-down box, or arrow.