The 52 Hi/Low Value represents the current percentile of the stock (or sector) relative to it’s 52 week 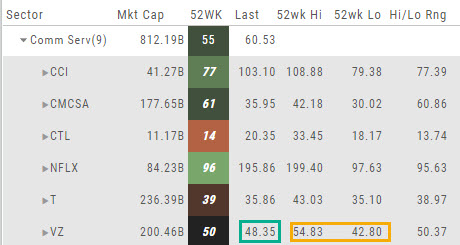 high/low price range. The Sector Value is the average of stocks within that sector.
In the Communication Services example, the average for the Sector is 55. When expanded, we see Netflix (NFLX) is near the top of it’s 52-week range at 96. Centurylink (CTL) is closer to the low end of it’s range at 14. Verizon’s current price is in the middle of the High-Low range.
This information is also available on the Map View but hovering your cursor over a stock tile while in 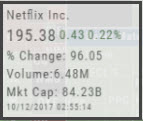 the 52 Wk Hi-Low View. Netflix shows the stock is at the 96th percentile of it’s high-low range.
Remember, you can refer to the Legend (found in the upper right part of the screen) for defined range values for any criteria view you select.