Portfolio
Manage Your Portfolio from the Platform
With Brokerage Integration you can trade directly from the platform with select brokerage firms. Currently TD Ameritrade and Choice Trade are available. With more on the way.

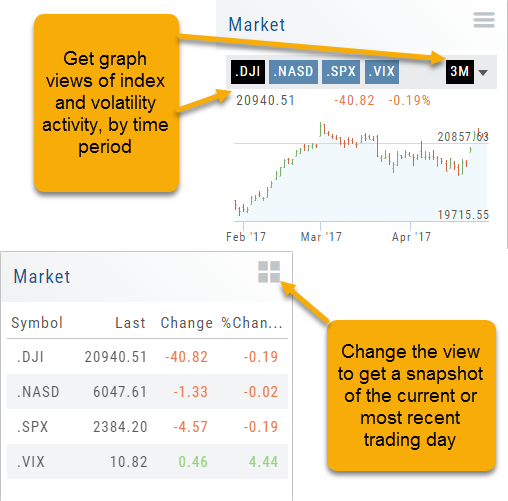
Market - Index Overview
In the default Graph View, get an visual view of Market or Volatility Index activity by a 1-day or 1, 3 or 6 month time frame. By sliding your cursor along the graph, an activity box will display more in-depth activity: Every two minutes for the 1-Day Graph, or Daily for the 1, 3 or 6 month graph.
The current market activity/most recent trading day, regardless of time-frame, is present on the default view under the Index box selections – or by selecting the List View to get: Current, point change and percentage change (green = positive, red= negative).
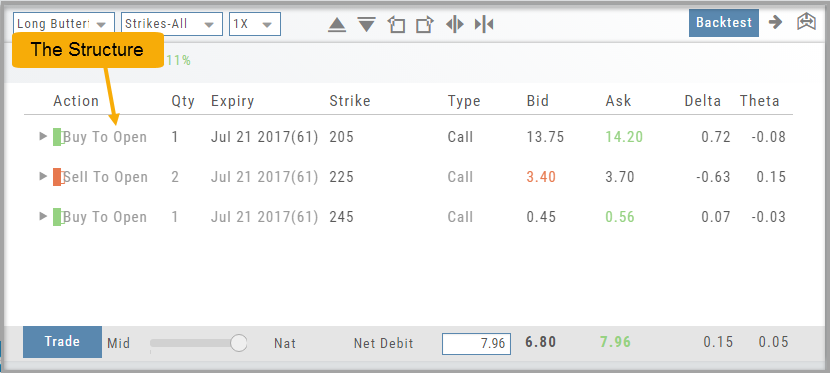
Strategy Template
A Strategy Template provides a shortcut to quickly create an option strategy, virtually eliminating structure errors. Once selected, you can modify the structure within the template using the tools on above the option tables: Moving Strikes up/down, rolling Time out/in, widening or narrowing Strikes.
![]()
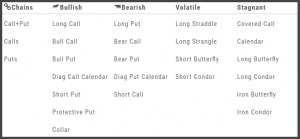
Some strategies can be changed from all Calls to all Puts (and vice-versa).
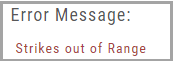
Note: The templates will not allow you to exceed certain parameters, as attempting to do so would result in an invalid strategy. This is a built-in safety net and you would receive a notice similar to:
Watch - The Next Step
The Outlook.
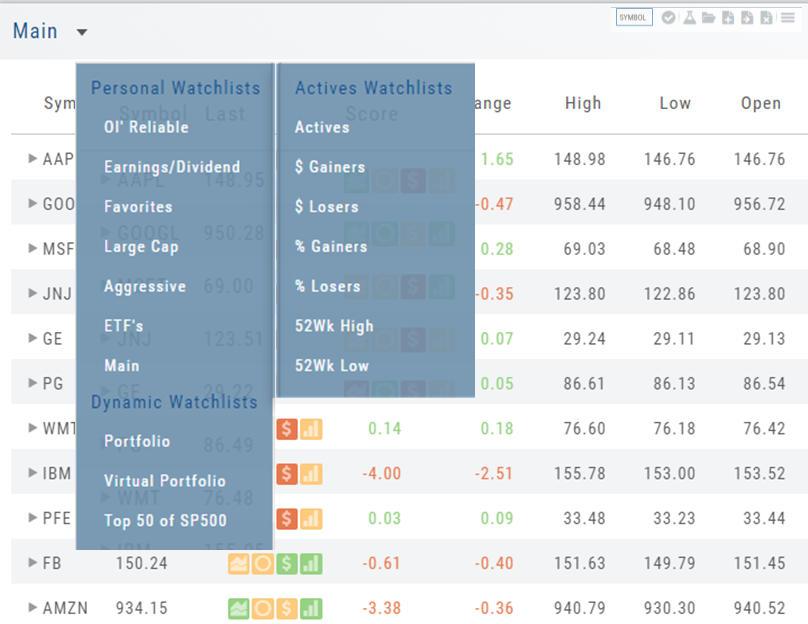
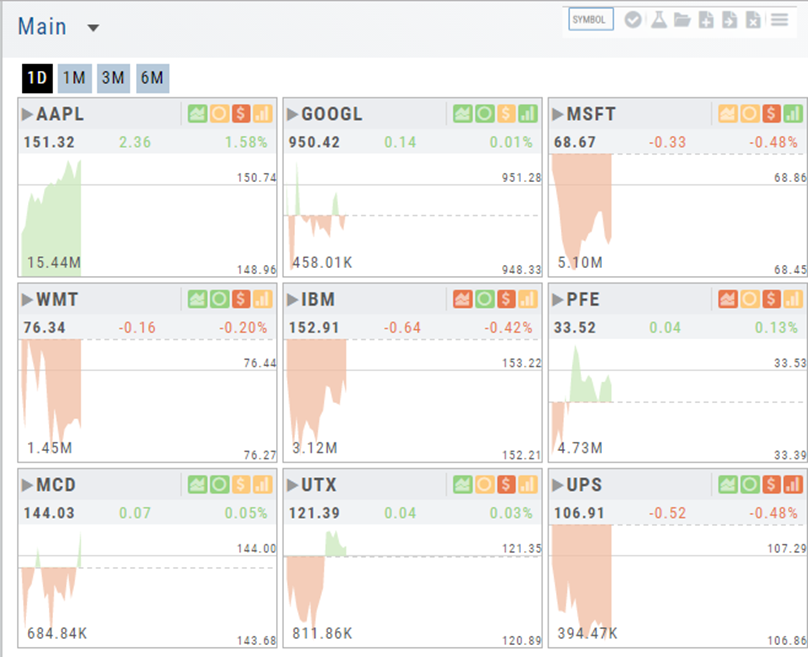
You’ve checked the overall markets, found some stocks with matching outlook. Now to keep track of them. This platform allows you to create customized Watchlists – always with the ability to manage them by adding to transferring between or deleting from any list.
View them by a List or Tile View. Both options give you navigational tools to further research such as action arrows and The Score icons.
Tile View offers 1 Day, 1 Month, 3 Month and 6 Month periodicies.
List View allows you to sort stocks by symbol, most recent price, Change, % Change, etc.
Both Tile and List View a ‘bird’s eye view’ of the stock, can be moved to the Reseach Tab, added, transferred or deleted from a Watchlist.
“Personal Watchlists” – create your own lists tailored to your strategies and current market conditions.
Default lists such as “Large Cap”, “Main” and “ETFs” are already included.
“Active Watchlists“- lists stocks most active, gainers/losers and those at their 52 week high/low.
“Dynamic Watchlists“- are system generated and maintained lists.
“Virtual Watchlists” – automatically populates with the stocks trading in your virtual account.
Options Navigation
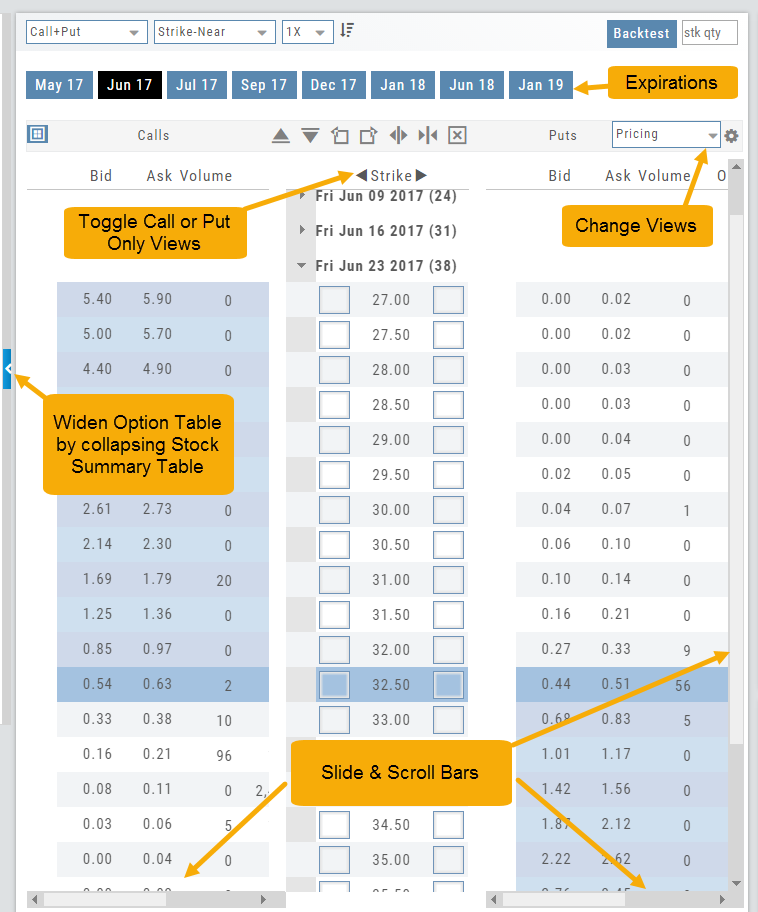
Expirations are displayed above the Option Table.
Select the months to view by clicking on the appropriate box. All available dates are displayed. Remember, the further out the option expiration is, the fewer dates are available.
Toggle between Calls Only or Puts Only view.
Change Option Table views to Pricing, Value, Greeks, Trade or new Custom views you create to suit your needs.
The small tab on the left side of the table will collapse the stock summary box & widen the option table.
The scroll bar on the right side and slide bars at the bottom on the table offer additional navigation.

Research
Narrow the field to find the highest probability trades.
Stock
You’ve narrowed the field by selecting potential candidates matching the outlook and selected strategy, but which of those have the highest probability of success? Research allows you to drill down for information as much or as little as you want.
The Dashboard provides an overview: Quote Detail, The Score, Activity such as News/Earnings/Dividends and information about the Company and a list of other company stock symbols in the same industry. Each component has it’s own tab to provide more detail.
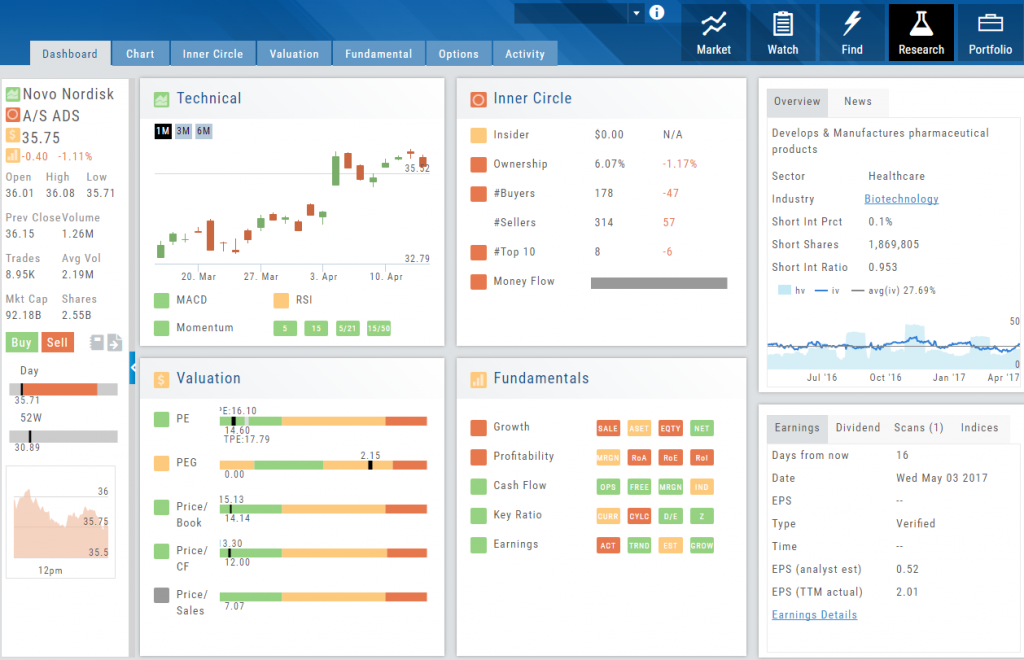
Components of The Score are designed to keep the information available to you, but out of the way when you don’t need it.
The Options Tab offers Strategy templates, option chains, snapshots and definitions of strategies, P/L Graph with Risk/Reward ratio, Analytics and Stock/Volatility charts.
The Activity Tab includes a Beta version of the Journal as well as News and StockTwits ®
Advanced/Declined & Highs/Lows
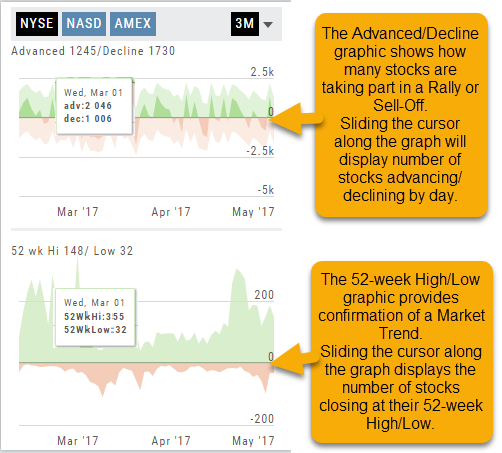
The Graphs on the left side of the Market page can provide confirmation of whether there was a Rally or Sell-Off in the time frame selected by providing the numbers of stocks taking part in of the movement.
The 52-week High/Low Graph further confirms if there is a Market Trend by showing how many stocks closed at their 52-week High/Low.
Note, you can select a 1, 3 or 6 Month or 1 Year time frame in which to view the data. By sliding the cursor along the horizontal ‘0’ (zero) line on each graph, data for each day will appear.
The Power of "The Score"
Our Proprietary Scoring System: Technical Analysis, Inner Circle, Valuation, and Fundamentals.
Designed with your workflow in mind and to give you the level of information you want, while keeping it out of the way when you don’t.
The order of The Score is based on the speed at which the stock is affected: Technicals being the fastest, and Fundamentals the slowest. For example, a very short term trader may not put as much weight on Fundamentals as with the Chart. However, as an actively managing investor, Fundamentals will be more influential on your trades.
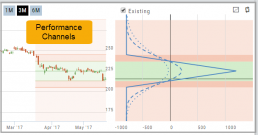
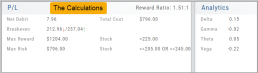
Storyboard of the Strategy
We also display a storyboard-like view of the selected strategy. It is a combination of chart, risk graph, and performance channel constructed within one panel.
This storyboard gives you the full picture of the position: The Structure, Performance Channels and Calculations.
Scans - Find Opportunities - Overview
Stagnant? Uncertain? Bearish or Bullish? Short or long term? No problem!
This “Find” category is where to find opportunities based on current Market activity and outlook, or select opportunities based on events, such as Earnings or Dividend announcements.
Whether looking for opportunities based on The Score, Events, Chart Patterns, Bullish, Bearish, Stagnant or Unknown outlook, a scan will help you find potential trade opportunities. 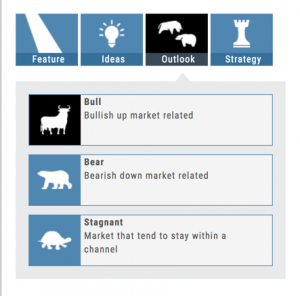
You can drill-down for scans by Category, Sub-Categories, then Group.
Example: Strategy>Time Spreads>Call Calendar Spreads. You can use the drop-down box, above the Category boxes to search for the scan you want or type in the box a generality about the scan. Examples: “Earning”, “Bull”, “Bearish”. “Score”, “Red”, “Green” will yield scans with that particular name in the scan