Price Slices
Price Slices allow users to view theoretical outcomes of option positions, while providing the flexibility of changing data points, such as entry price or what the results will be if the stock price moves a specific dollar or percentage amount.
This feature is helpful with building discipline on when to exit a trade if it goes against you.
This feature is accessible when using the Strategy Templates on the Research>Option Tab
The default starting points include:
- Entry Point – shown in Blue in our example.
- High Point – considered Target or Resistance point – shown in Green.
- Low Point – considered Stop or Support point – shown in Red
(Up to 7 Price slices can be added for additional evaluation. See below for more details)
On Research>Option Tab, click the down arrow next to the default “Call+Put” view in the upper left corner of the window to access the Strategy Templates:
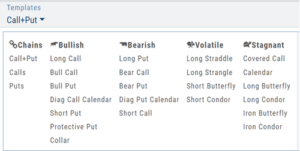
Select your Strategy and set up the position:
Quantity, Expiration Date, Strikes
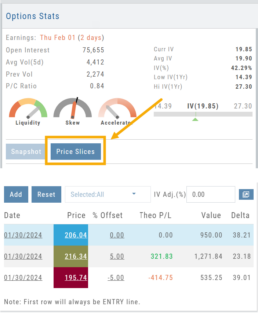
On the right side of the same screen, click the ![]() button to display the default settings.
button to display the default settings.
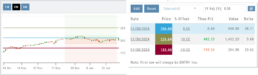
Using our example:
Entry point is $206.04 (Current Stock Price) shown in Blue
High point – defaults to 5% above Entry: $216.34, shown in Green/Gold
Low point – defaults to 5% below Entry: $195.74, shown in Red
The values are for ‘today’: what the Profit or Loss would be if the stock price were the High or Low price.
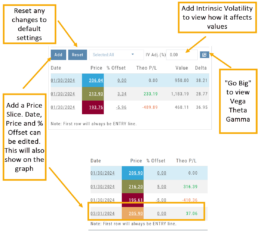
The Date, Price and/or % Offset can be manually adjusted, as indicated by the underline – to view different scenarios.
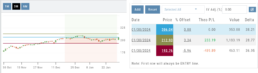
Price Slices – Adjust the % Offset Value
% Offset values were manually changed to 10% and -10%.
The lines on the graph are dynamically updated
Price Slices – Adjust the lines
In this example, the Top and Bottom lines were adjusted on the graph itself.
The new placement dynamically updated the values on the right.
Price Slices – Add, Reset, Go Big