Trading from the Option Template
From Template to trade is easy. 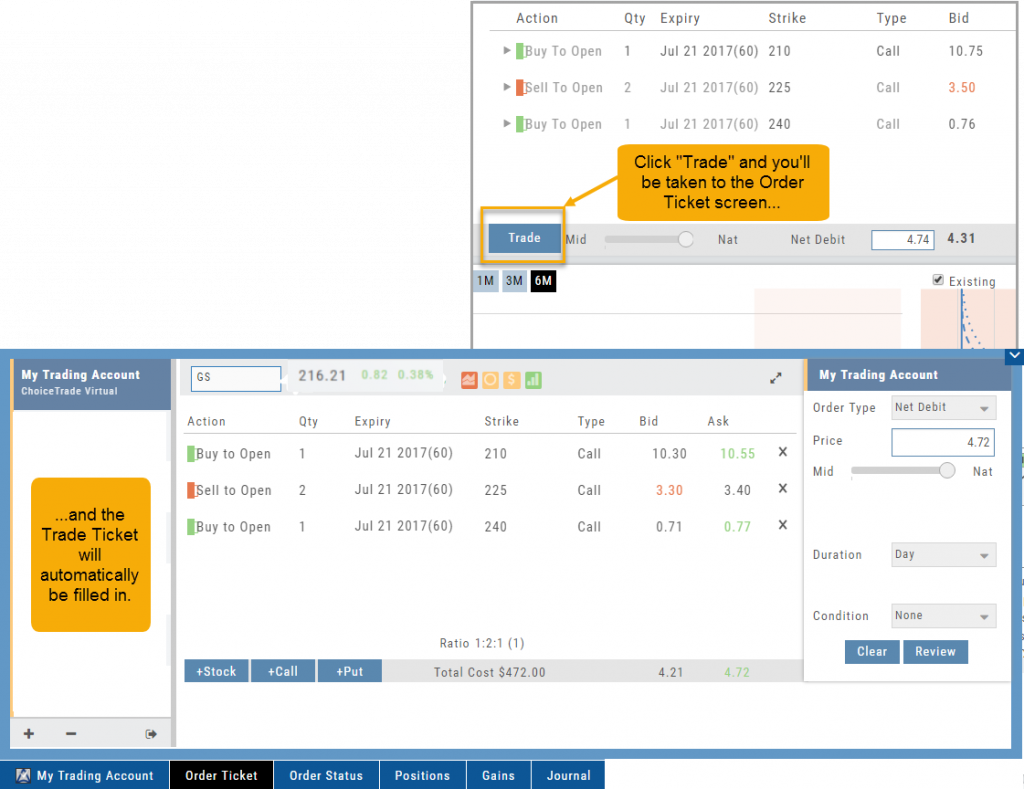
Simply click the “Trade” button on the Option Template and the Order Ticket will be filled in for you. This not only saves time, but eliminates order entry errors.
You can connect directly to select brokerage firms right from the platform and execute the trade.
Trading from Options Page & Strategy Templates
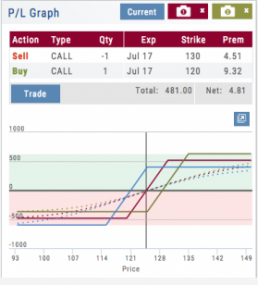
Structure and analyze any options position. When ready, click “Trade” to create and submit an Order Ticket.
Comparing trades with Snap? ![]()
Simply choose the structure you want then select “Trade” to send it to the Order Ticket.
Trading multi-leg positions is easier than ever!
Explore - Give it a try!
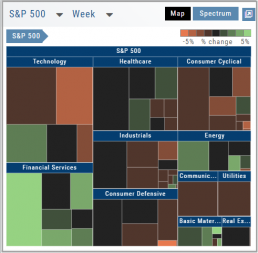
From finding the best stock in the best sector to following where the money is flowing to and from, Heat Maps (and Spectrum, too!) offer insight both interesting and valuable.
Drill down for bullish, bearish and stagnant opportunities.
Save Backtested Trades to Manual Account
Want to keep record of backtested trades?
Send them to the Manual Account. While in Backtest Mode, structure your trade as usual in the Options Chain or in a Strategy Template. Then click “Save”.
The “Trade” button becomes “Save” when in Backtest Mode.
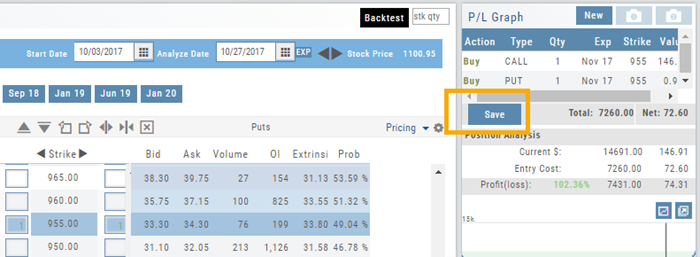
You have the option of saving the Entry or Entry and Exit of the trade. Each tab has specific information such as Total Cost when opening the trade and Total Credit (Debit) when Exiting the Trade.
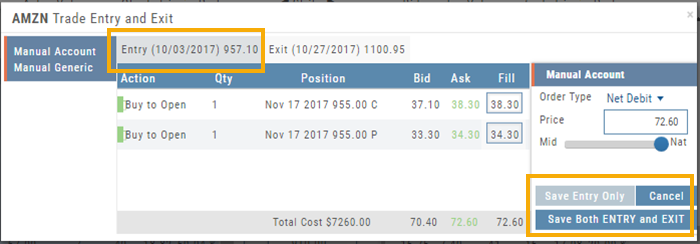
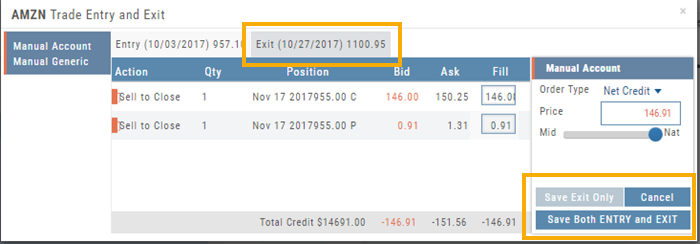
You’ll have the option to Save both the Entry and Exit positions on the “ticket”. You can also choose to save only the Entry OR Exit if you wish. So if you want to post an opening trade on a past date, but still have it open now, you can Save Entry Only on the Entry part of the Ticket.
Journal too
Once saved, you can see these trades in your Journal. You can add notes and tags. Simply click Journal in Order Status, or edit in the Journal.
Delete Journal Entries
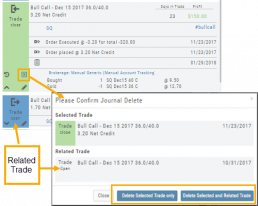
Whether you entered a trade incorrectly, or want to remove Cancelled Orders from your Virtual or Manual Account, you have the ability to delete a Journal Entry.
Simply expand the Trade tab and click on the ![]() icon.
icon.
If you are deleting Cancelled or Expired orders, you’ll be prompted to confirm you want to delete the entry.
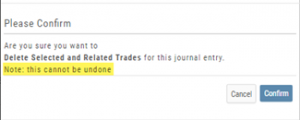
For trades that have a specific Open and/or a specific Close, you’ll be prompted to choose either Selected Trade or Selected and Related Trade, if applicable.
Prior to deleting your selection, you’ll be prompted to confirm the action. Once deleted, the trade cannot be restored.
Note: Deleting a Journal entry for a Manual Account will remove the trade completely from both the Journal and Manual Account.
Deleting a Journal entry for Real or Virtual Accounts only remove the Journal entry, and the trade will remain in the account.
The Power of Time
The Backtesting feature allows for an interactive way to understand the characteristic of the strategy.
You can also see it’s performance over real data without having to wait for the market.
Give it a try!

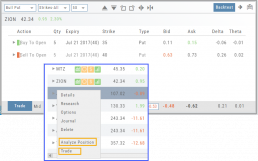
From Strategize to Analyze to Trade
Any strategy-specific options trade will have ‘Analyze’ and ‘Trade’ in the Action Icon.
Click ‘Analyze’ to see the trade in the options chain. From there, you can edit or click ‘Trade’ to have the trade sent to the Order Ticket of your brokerage account.
Give it a try!
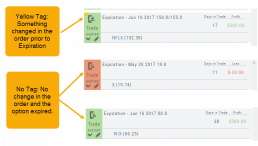
Journal - Color Tagging
After Reconciling your closed trades, click “OK” to have the Journal entries updated.
Yellow tag: There was a change in the Option position. For example, an option was exercised before expiration – or the order was adjusted.
No tag: There was no change and the Option expired worthless.
Green Tab: Profitable trade
Red Tab: Losing trade
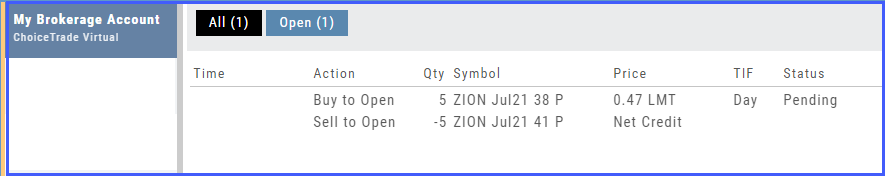
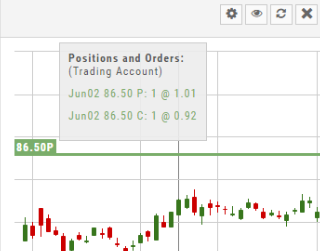
Working Orders Displayed on Chart
Charts display working orders and existing positions of selected brokerage accounts, currently Choice Trade and TD Ameritrade. More brokerages will be forthcoming.
- Stocks show a horizontal line at the entry price.
- Options show a horizontal line at the strike price.
- Green for Long and Red for Short.
The group of 4 icons, located above the Working Order, allow you to Edit (Gear), Hide(Eye) Refresh (Circle arrows) or Remove (X).
![]()
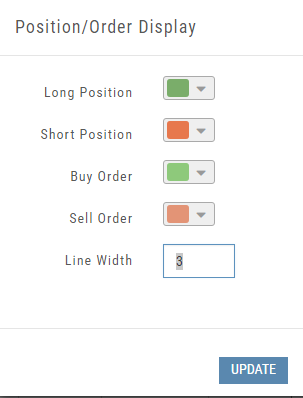
Display choices including colors and line width are available in settings by clicking the “Gear” Icon.
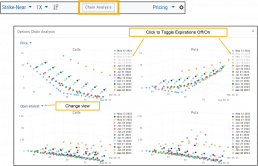
Options Chain Analysis
The Option Chain pages offers a 3-D analysis comparing expiration dates by selected criteria.
Click on “Chain Analysis” to display the graph.
Use the drop-down boxes to view the tables by Implied Volatility, Volume, Open Interest, Price, Extrinsic Value, Delta or Intrinsic Value.
Toggle the view by using the clickable legend to select the Expiration Dates to view.