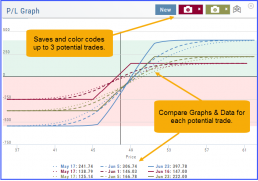
Profit/Loss Graphs
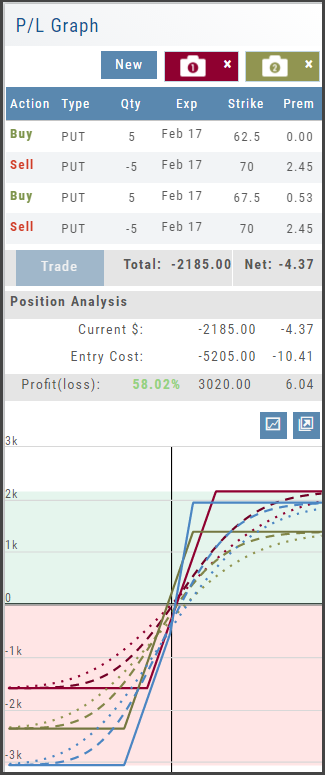
Any position entered in the Options Chain (Calls+Puts, Calls or Puts) will automatically display a profit/loss risk graph. The P/L Graph shows the Trade Profile Performance from the current day.
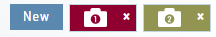
You can compare up to three (3) positions on one graph by utilizing the Camera Icons. Once you complete one trade scenario, click the first camera then click ‘New’. Structure your second trade scenario, click on the second camera. To add a third scenario, click new to structure an additional trade. The graphs will overlay.
Heap Map View
Each box in the Map View represents either an industry group or a stock when you drill down. The size of the box represents the market cap. 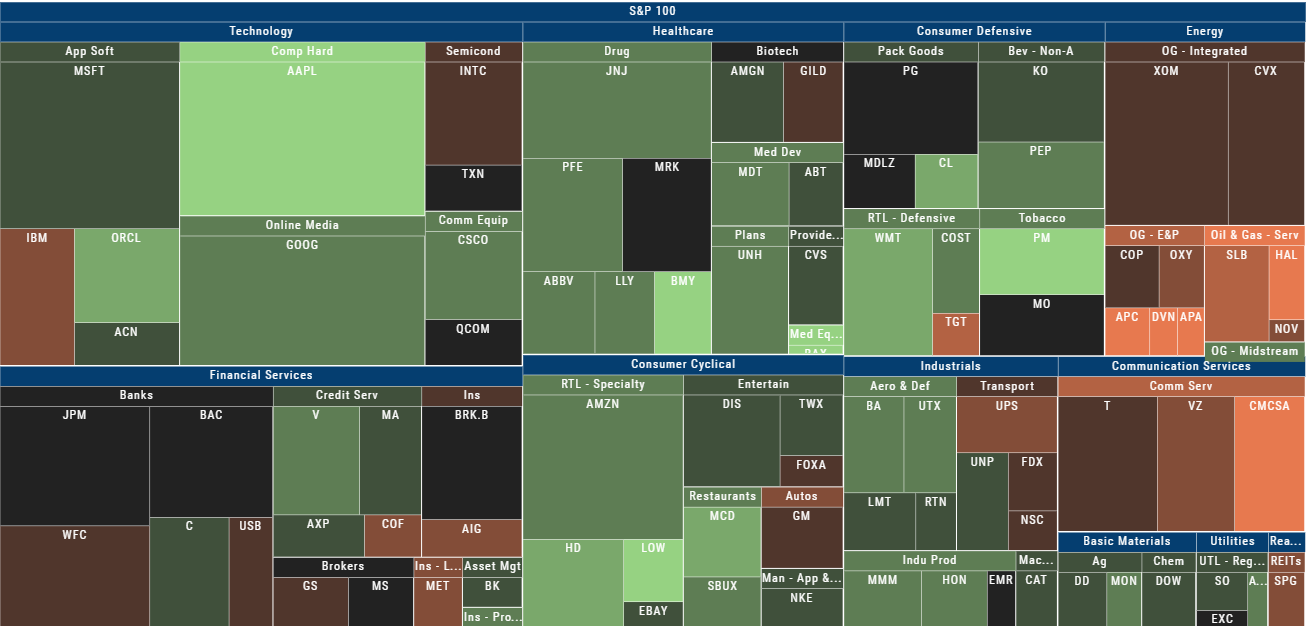
The color represents the data displayed (default : % change) for the time frame selected.
In the Market Tab, select the ‘Go Big’ option in Heat Map for more detail.
You have the capability to adjust your Map based on Stock Price, Average Volume, Market Cap and % Change.
Bonus: The platform will remember your filters until you reset them during the current session.
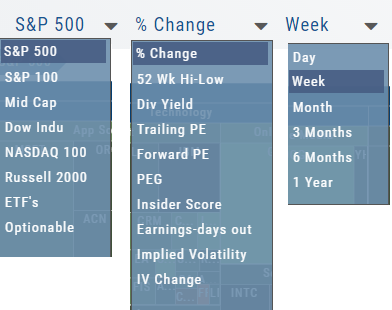
Heat Map Data Points
Drop-down menus allow you to select Index, Time Frame and various Data Points. Choose among % Change, Dividend Yield, PEG, 52 week High-Low and more.
Special Maps like Insider Score, Days to Next Earnings, and Implied Volatility are also included.
And of course, by selecting an individual box (stock) for Quote Detail and use the Navigational Icons to Research, add to Watch Lists, Submit a Trade, etc.
52 Week High/Low Value
The 52 Hi/Low Value represents the current percentile of the stock (or sector) relative to it’s 52 week 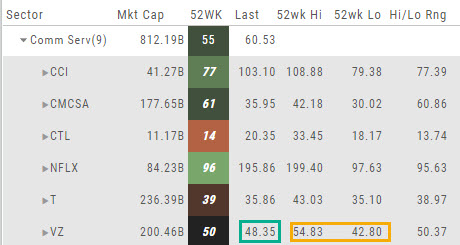 high/low price range. The Sector Value is the average of stocks within that sector.
In the Communication Services example, the average for the Sector is 55. When expanded, we see Netflix (NFLX) is near the top of it’s 52-week range at 96. Centurylink (CTL) is closer to the low end of it’s range at 14. Verizon’s current price is in the middle of the High-Low range.
This information is also available on the Map View but hovering your cursor over a stock tile while in 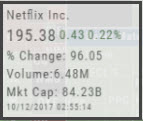 the 52 Wk Hi-Low View. Netflix shows the stock is at the 96th percentile of it’s high-low range.
Remember, you can refer to the Legend (found in the upper right part of the screen) for defined range values for any criteria view you select.
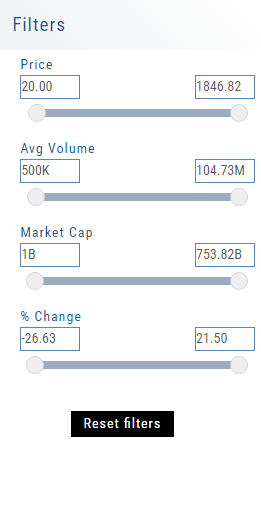
Heat Map Filters
Bonus! The Platform remembers your Preferences!
Select the view you like and it will be saved during your current session – even when you navigate elsewhere on the platform. The system will remember the map/spectrum view you set. This includes the type and time period as well.
Streamline your results by using the Filters for Price, Average Volume, Market Cap, and more. The data will be displayed dynamically based on filter changes. You can set your filters and the Platform will remember it until you change or reset it during the current session.
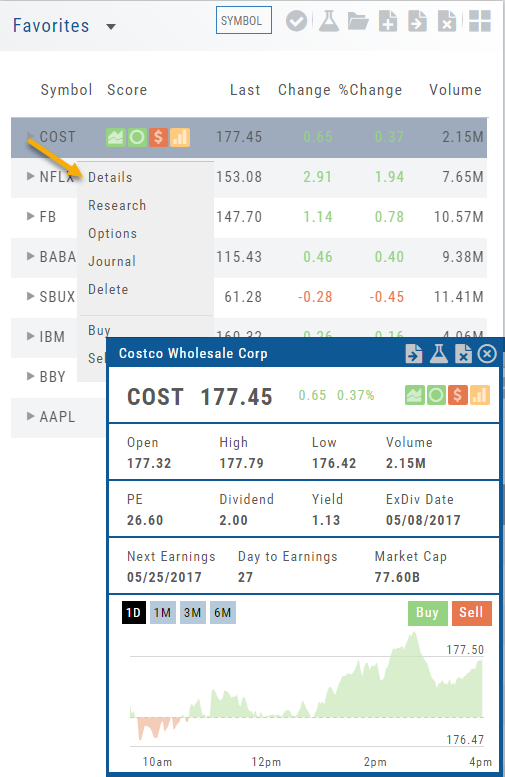
Quote Detail without leaving the List
A quick snapshot of a stock with navigational tools.
The Action Arrow Icon will provide a pop-up Quote Detail window including the current price, trading volume, Dividend Date -if applicable, Earnings Date and more. A chart, on the bottom part of the Detail Box, allows for difference periodices: 1 Day, 1,3 or 6 Months.
Notice the additional icons in the Quote Detail: You can send this stock to one of your Watch Lists, to Research or delete the stock if you wish. The Score Icons will direct you to the appropriate Research function. Buy/Sell buttons allow for quick order placing.
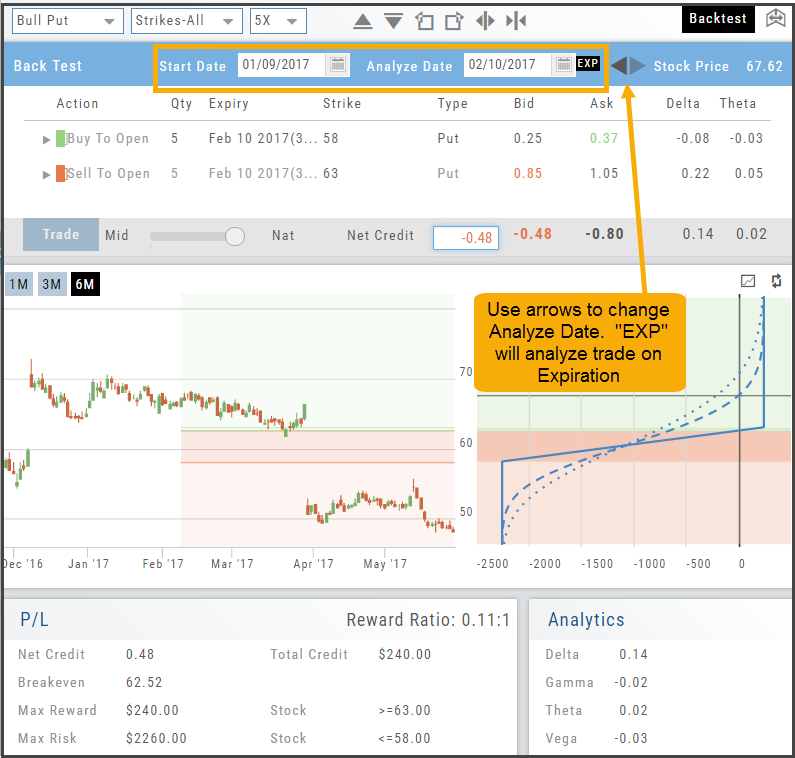
Backtesting Trade Finder scans
You can ‘look back’ (Backtest) Trade Finder Scans by following these steps:
- Select your Scan (example: Bull Put – Stock above 200 SMA).
- Click on the Calendar at the top of the screen to select a previous date (clicking on the month allows you to select a previous month, or arrow back to a previous year).
- Select stock symbol, click on action icon to ‘Analyze Position’.
- The trade template will populate with the specific scan, note the date on the screen is the ‘start date’
- Select the Analyze Date, or click ‘EXP’ to analyze the position on Expiration Day.
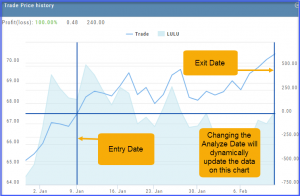
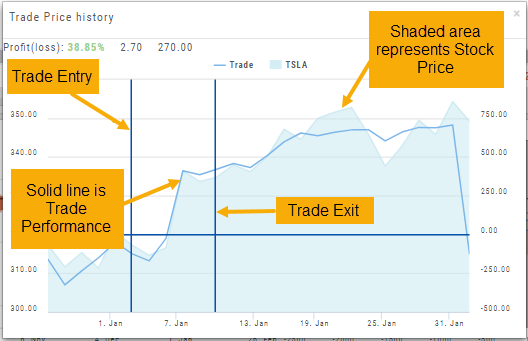
By clicking on the ‘Go Big’ icon of the The Trade Price chart shows the Entry and Exit Dates (cross hairs) as well as the behavior of the trade compared to the stock.
Note: Changing the analyze date dynamically changes the data of the P/L chart.
Use SNAP to Backtest Positions
The Snapshot feature is also available with Backtesting.
- Click ‘Backtest’ on the Option Table
- Set up position
- Click one of the camera icons:
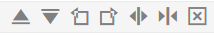
- Repeat the first step using the Rolling Icons to adjust the initial position to a new scenario:
- Click the 2nd camera icon & repeat the above steps for the last comparison.
- Select the ‘Analyze Date’ using the Date Picker (Calendar) or “EXP” to analyze the position on Expiration Date.

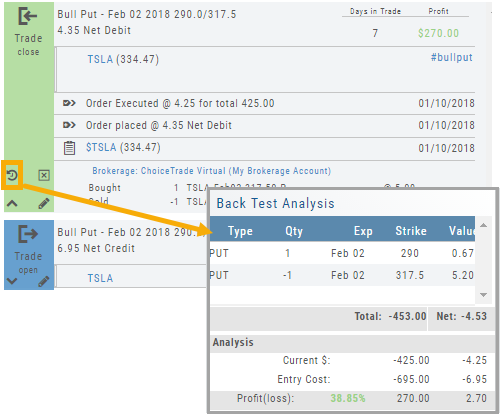
Backtest from the Journal
You can “Replay” a trade from your Journal by sending it to Backtest Analysis.
Click on the ![]() icon on the Journal trade tab.
icon on the Journal trade tab.
Trades are sent to the specific strategy template of the trade.
If you click on the “Trade Open” tab, you will only get that view of the trade.
View the P/L, Price History, Stock Volatility Chart – be sure to utilize the “Go Big” function to see more detail of the trade.
Click Here for more on Backtesting
Note: This function is available on a “Clean” trade. Clean means there was a clean Open and a clean Close of the trade. There were no partial closings, ‘roll-ups’, adjustments or exercise/assignments.
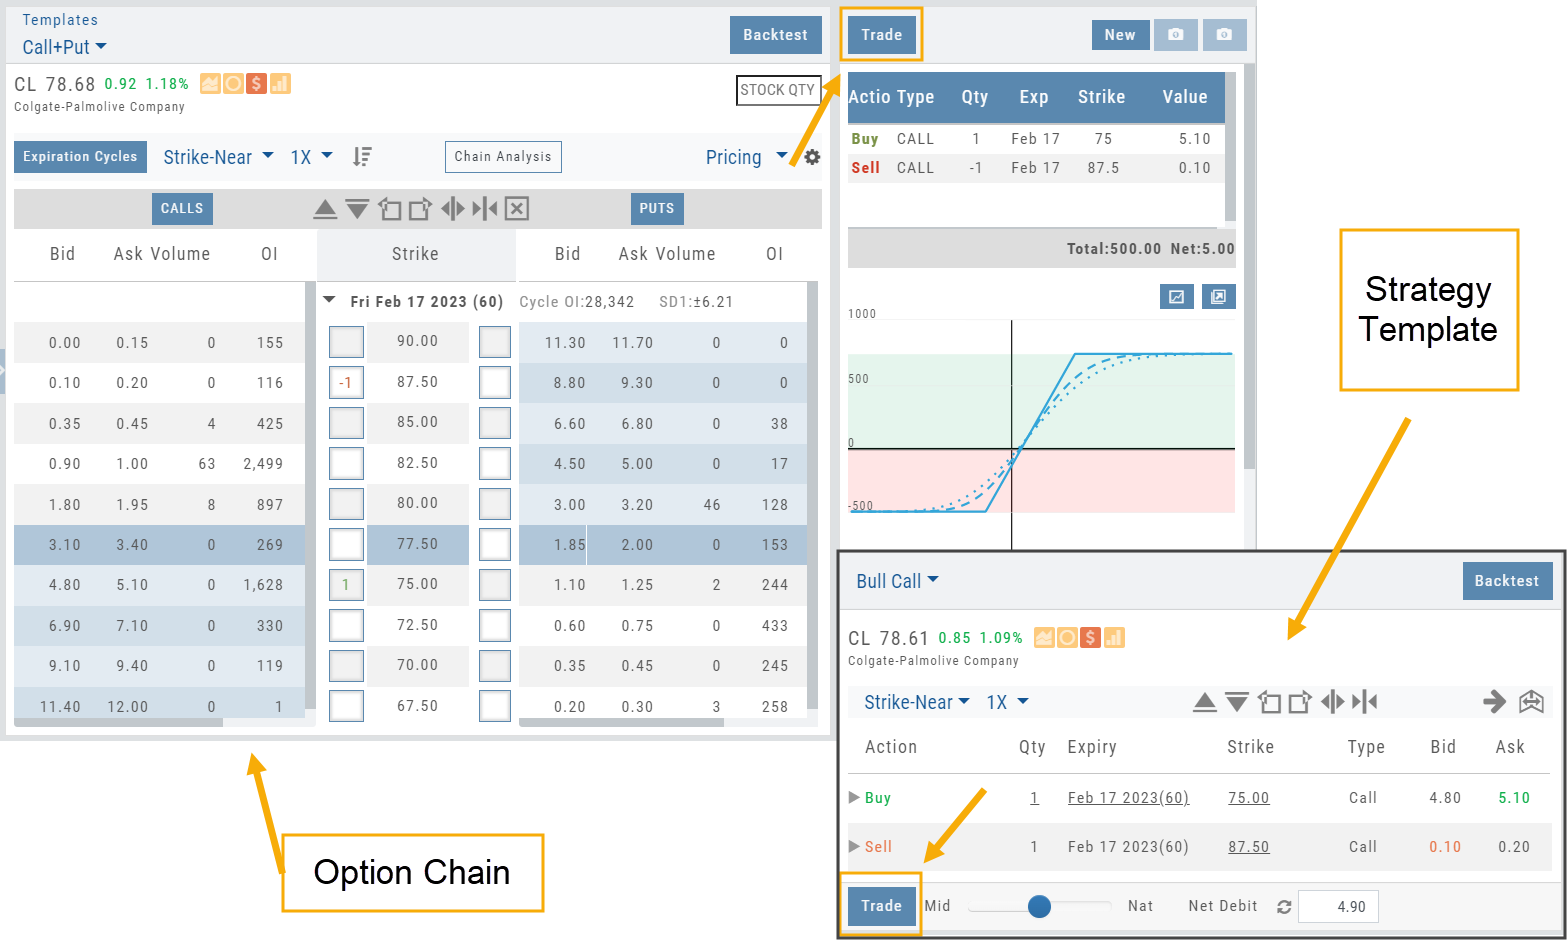
Trade from the Options Tab
Trading from the Options Table is easy!
When a position is set up on the Option Chain or from one of the Strategy Templates, simply click the “Trade” button.
The Position will be sent to the Order Ticket where you can further edit:
- Adjust Price between “Mid” and “Nat”
- Change Duration: Day or Good Til Cancelled
- Change Order Type: Limit, Market, etc.
- Click “Review” to confirm Order Details and Account are correct
- Then “Submit” to send to brokerage.