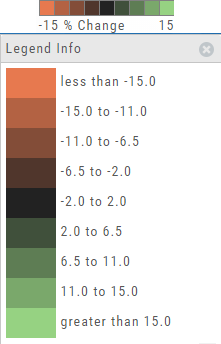
The Legend shows the range of % negative or positive change represented by a color spectrum. It is important to note: the range does adjust according to the data filters you select for the Heat or Spectrum Maps.
Clicking on the legend will show specific range of each color in the spectrum and give additional information about the definition.