After the position is entered, click on the “Analyze Date” calendar to select the date.
![]()
You can click “EXP” to further analyze the trade on the option’s expiration date or use the arrows to move the original analyze date forward or back.
Your Position Analysis will display with estimated gain/loss calculations and the P/L Graph. 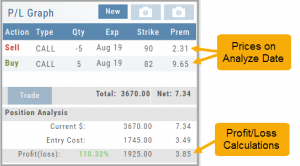
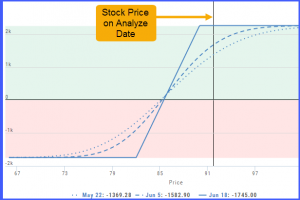
The P/L Graph will also display the stock price on the analyze date via the vertical line.
 Note: The prices in the options chain will show the start date prices. The prices in the Analysis Panel will reflect the Analyze Date prices.
Once you have selected your date for analysis, you can edit the position, or try a different position, and the analysis will dynamically update.