How to use Backtesting
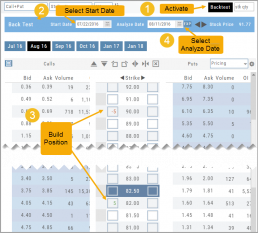
Activate by clicking “Backtest” in the upper right of the Option Table screen.
- Select a start date.
- Enter position in the options chain.
- Select analyze date.
Your position’s P/L Performance and Risk Chart are dynamically updated.
Start Date
Click the Calendar and select any past Market date. You can quickly choose a previous date by clicking on the “month” then arrow back by year. The closing price for that stock will be displayed.
You are now ready to create the position to analyze – either by clicking “Bid” or “Ask” or by entering the quantity in the appropriate box(es).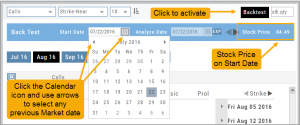
Note: In order to ‘backtest’, the platform needs to establish an orientation point in time. If you change the ‘start date’, the option expiration cycle may change to re-establish the reference point in which to pull information from.
Analyze Date
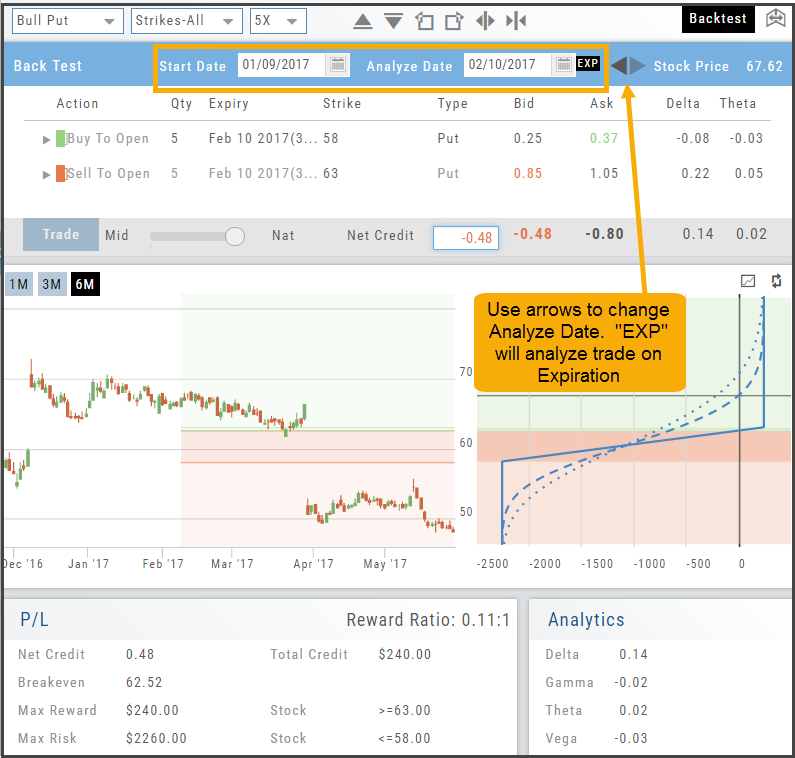
After the position is entered, click on the “Analyze Date” calendar to select the date.
![]()
You can click “EXP” to further analyze the trade on the option’s expiration date or use the arrows to move the original analyze date forward or back.
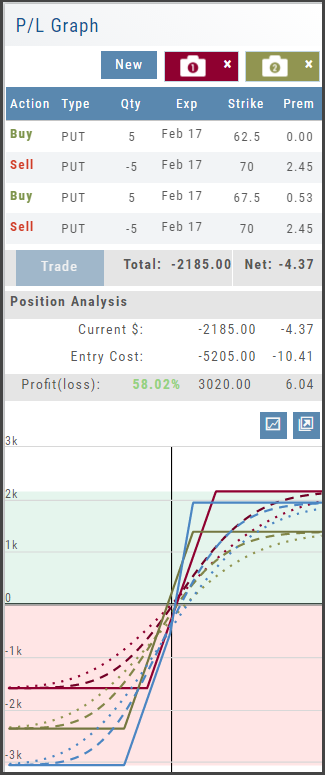
Your Position Analysis will display with estimated gain/loss calculations and the P/L Graph. 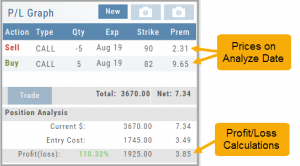
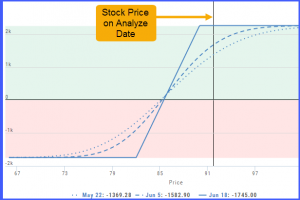
The P/L Graph will also display the stock price on the analyze date via the vertical line.
 Note: The prices in the options chain will show the start date prices. The prices in the Analysis Panel will reflect the Analyze Date prices.
Once you have selected your date for analysis, you can edit the position, or try a different position, and the analysis will dynamically update.
Backtesting Trade Finder scans
You can ‘look back’ (Backtest) Trade Finder Scans by following these steps:
- Select your Scan (example: Bull Put – Stock above 200 SMA).
- Click on the Calendar at the top of the screen to select a previous date (clicking on the month allows you to select a previous month, or arrow back to a previous year).
- Select stock symbol, click on action icon to ‘Analyze Position’.
- The trade template will populate with the specific scan, note the date on the screen is the ‘start date’
- Select the Analyze Date, or click ‘EXP’ to analyze the position on Expiration Day.
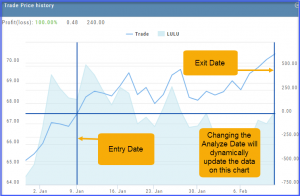
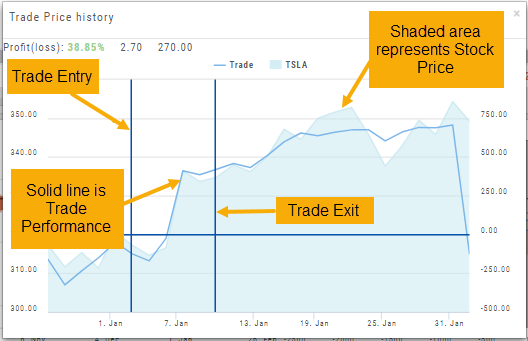
By clicking on the ‘Go Big’ icon of the The Trade Price chart shows the Entry and Exit Dates (cross hairs) as well as the behavior of the trade compared to the stock.
Note: Changing the analyze date dynamically changes the data of the P/L chart.
Use SNAP to Backtest Positions
The Snapshot feature is also available with Backtesting.
- Click ‘Backtest’ on the Option Table
- Set up position
- Click one of the camera icons:
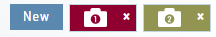
- Repeat the first step using the Rolling Icons to adjust the initial position to a new scenario:
- Click the 2nd camera icon & repeat the above steps for the last comparison.
- Select the ‘Analyze Date’ using the Date Picker (Calendar) or “EXP” to analyze the position on Expiration Date.

Backtest from the Journal
You can “Replay” a trade from your Journal by sending it to Backtest Analysis.
Click on the ![]() icon on the Journal trade tab.
icon on the Journal trade tab.
Trades are sent to the specific strategy template of the trade.
If you click on the “Trade Open” tab, you will only get that view of the trade.
View the P/L, Price History, Stock Volatility Chart – be sure to utilize the “Go Big” function to see more detail of the trade.
Click Here for more on Backtesting
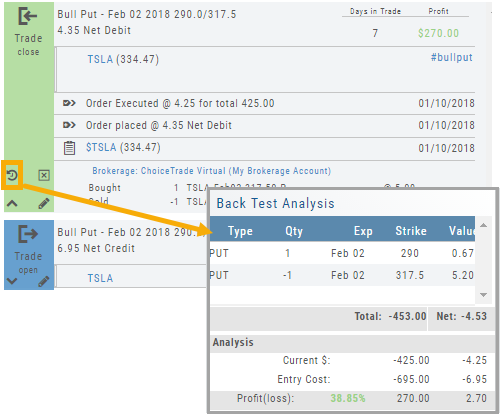
Note: This function is available on a “Clean” trade. Clean means there was a clean Open and a clean Close of the trade. There were no partial closings, ‘roll-ups’, adjustments or exercise/assignments.
Save Backtested Trades to Manual Account
Want to keep record of backtested trades?
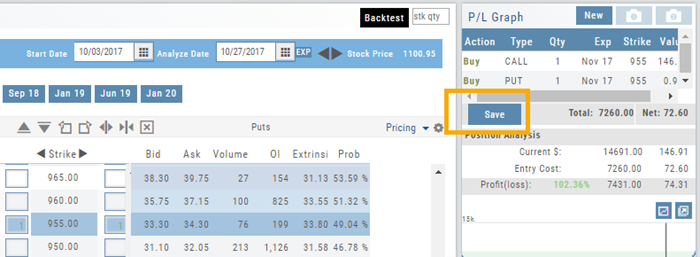
Send them to the Manual Account. While in Backtest Mode, structure your trade as usual in the Options Chain or in a Strategy Template. Then click “Save”.
The “Trade” button becomes “Save” when in Backtest Mode.
You have the option of saving the Entry or Entry and Exit of the trade. Each tab has specific information such as Total Cost when opening the trade and Total Credit (Debit) when Exiting the Trade.
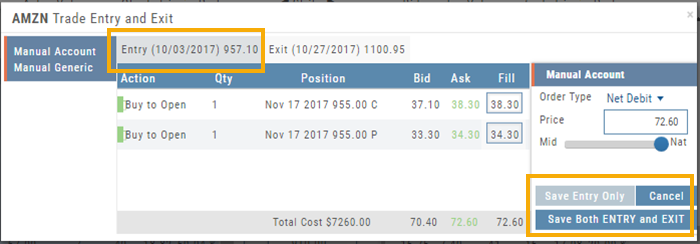
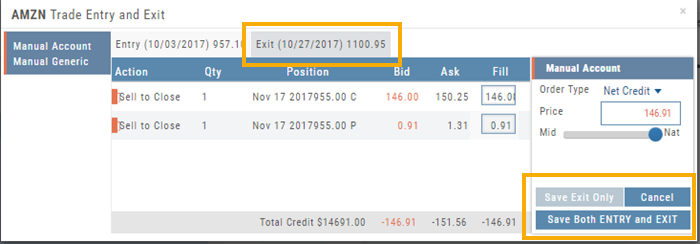
You’ll have the option to Save both the Entry and Exit positions on the “ticket”. You can also choose to save only the Entry OR Exit if you wish. So if you want to post an opening trade on a past date, but still have it open now, you can Save Entry Only on the Entry part of the Ticket.
Journal too
Once saved, you can see these trades in your Journal. You can add notes and tags. Simply click Journal in Order Status, or edit in the Journal.
The Power of Time
The Backtesting feature allows for an interactive way to understand the characteristic of the strategy.
You can also see it’s performance over real data without having to wait for the market.
Give it a try!