Find – Heatmap Page
Heat Map View


Spectrum View
Heat Map & Spectrum Overview
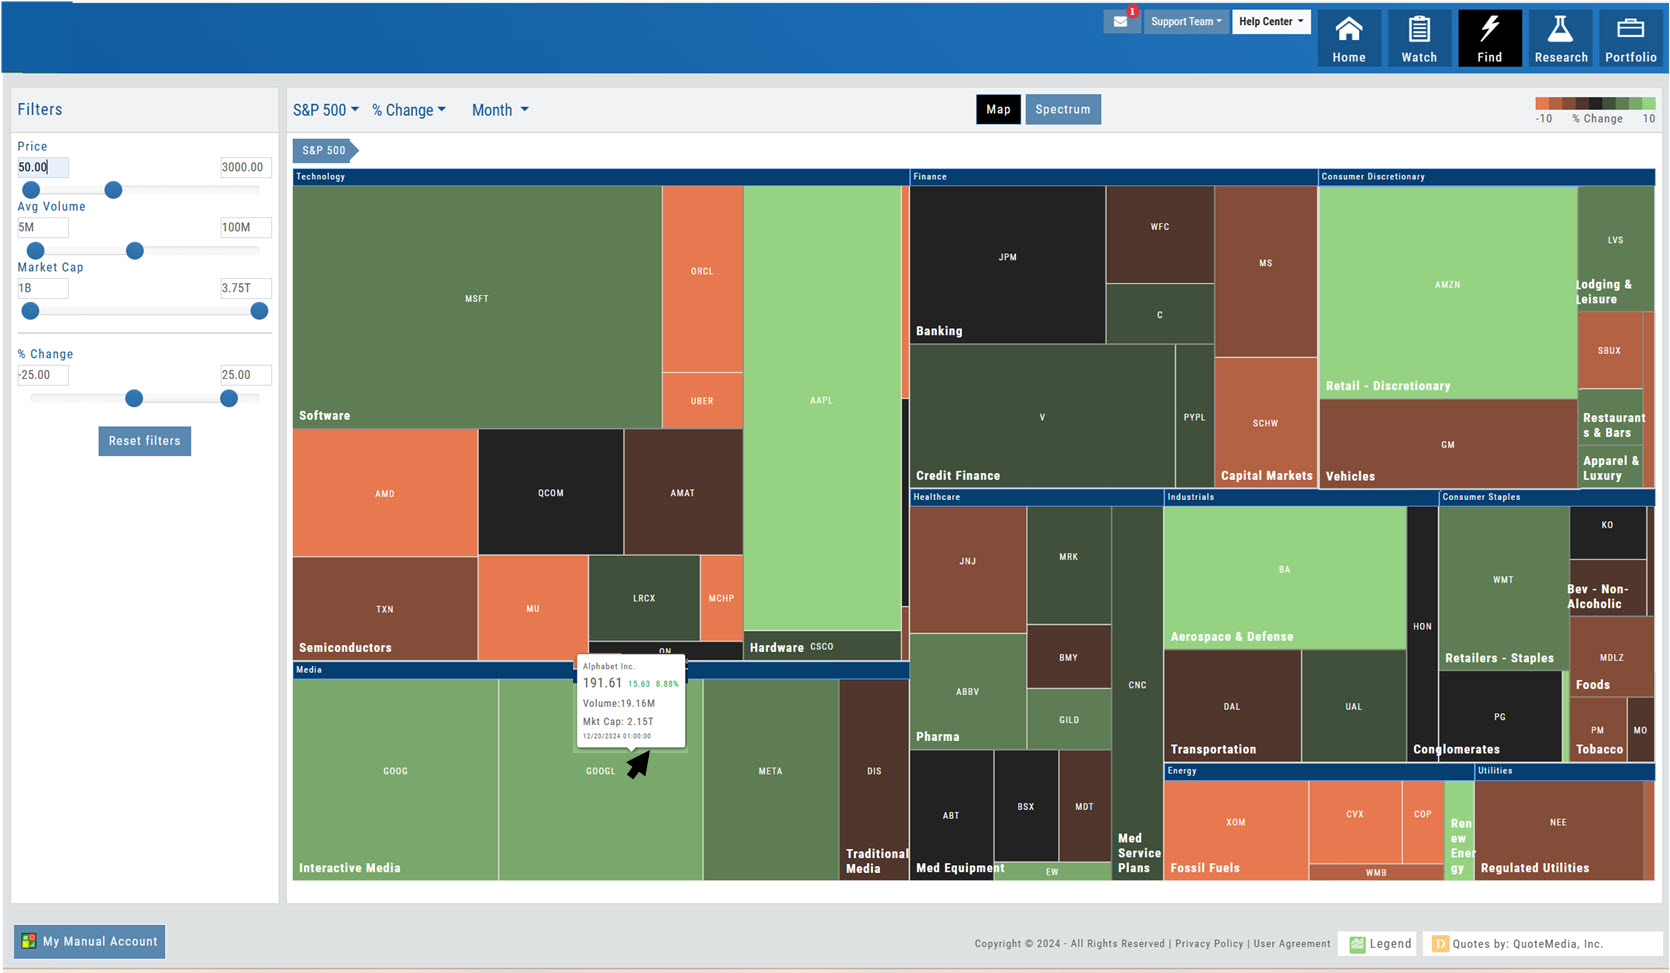
Broad Market Insight that allows you to drill down The Heat Maps are accessible in the Market tab and under Find>Explore and [...]
Posted in Market, Explore, Find, Heat Map
Tagged navigation, menu, How to, heat map, find
Leave a comment
The Legend – Heat and Spectrum Maps
The Legend shows the range of % negative or positive change represented by a color spectrum. It is important to [...]
Heap Map View
Each box in the Map View represents either an industry group or a stock when you drill down. The size of [...]
Spectrum Map View
In the Spectrum view, each column represents the slice of time selected: Day, Week, Month or Trailing Quarter. Once the [...]
Heat Map Data Points
Drop-down menus allow you to select Index, Time Frame and various Data Points. Choose among % Change, Dividend Yield, PEG, [...]
52 Week High/Low Value
The 52 Hi/Low Value represents the current percentile of the stock (or sector) relative to it’s 52 week high/low price [...]
Heat Map Filters
Bonus! The Platform remembers your Preferences! Select the view you like and it will be saved during your current session [...]
Posted in Explore, Heat Map
Tagged menu, How to, heat map, filters, spectrum, navigation
Leave a comment
Quote Detail without leaving the List
A quick snapshot of a stock with navigational tools. The Action Arrow Icon will provide a pop-up Quote Detail window [...]