Market


Platform Features Release: Economic Dashboard, Chart Adjustment, Chart Time Period
Announcing the latest Release of feature and functionality enhancements to the trading platform to improve the investment/trading decision process. Economic [...]
Posted in Economic Dashboard, Market, Location, Release Notes, Charting, Functionality, Charts
Tagged chart, time periods, Economic reports, research, market
Leave a comment
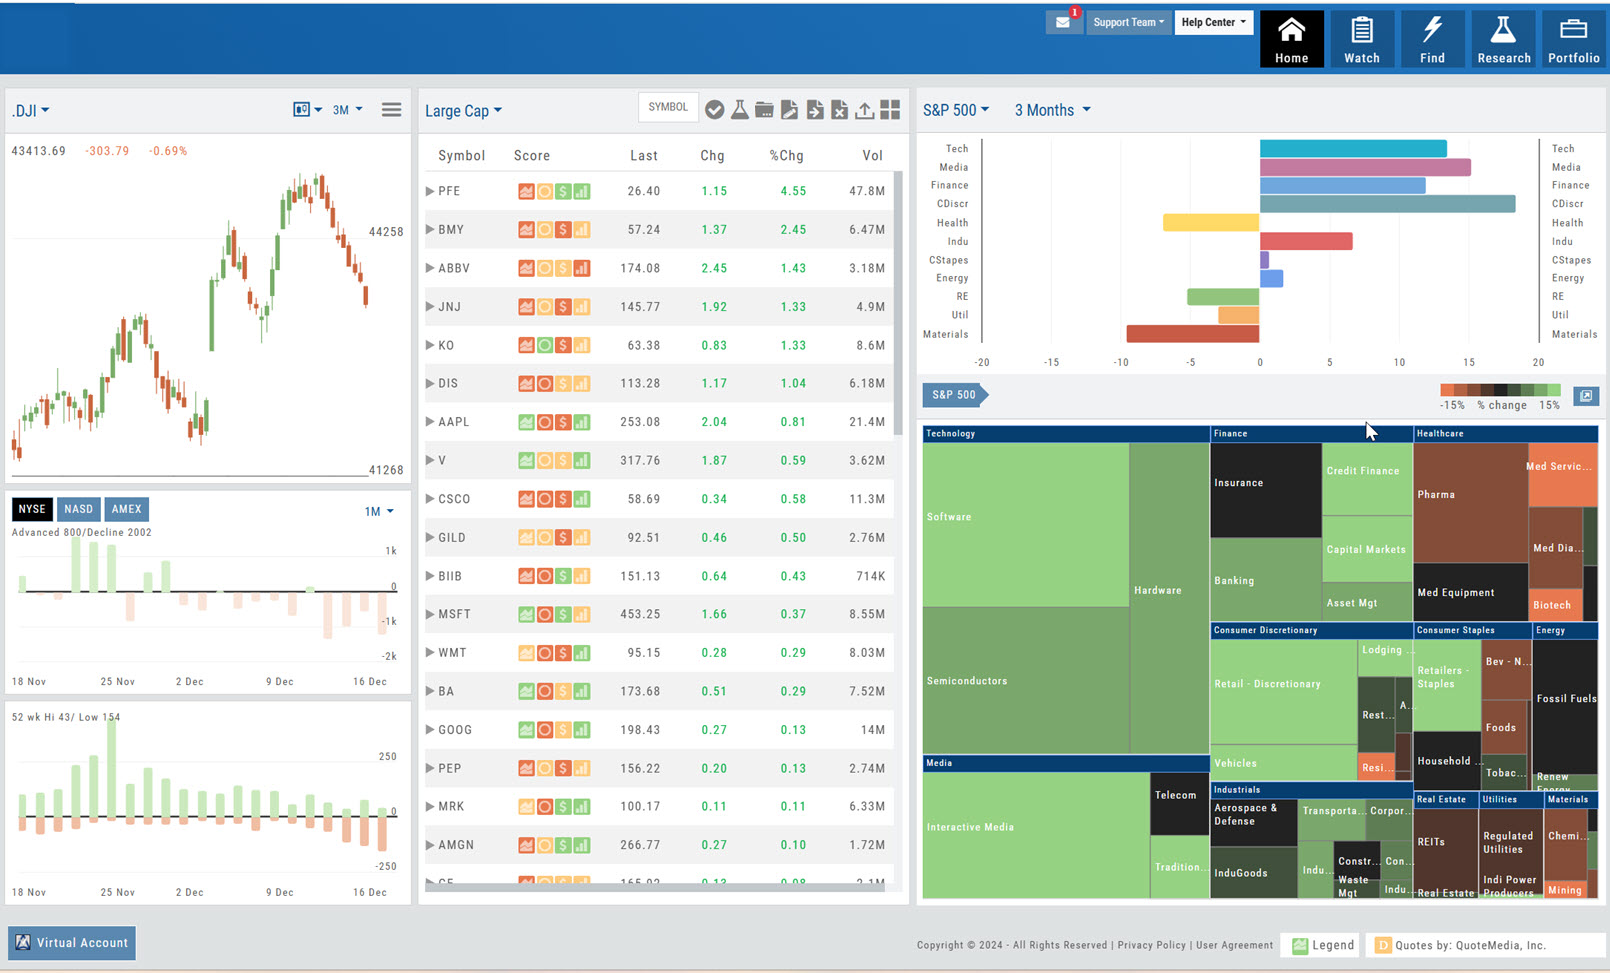
Market – The Big Picture
Start here for the overall outlook. Designed to show what the overall markets are doing by viewing the graphs, charts [...]
Market Overview: Get more of a broad view
View activity of the NYSE, Nasdaq or American Stock Exchange by time frame. The upper area of this part of [...]
Market – Index Overview
In the default Graph View, get an visual view of Market or Volatility Index activity by a 1-day or 1, [...]
Advanced/Declined & Highs/Lows
The Graphs on the left side of the Market page can provide confirmation of whether there was a Rally or [...]
Posted in Stock Research, Market
Tagged market, index, graph, navigation, menu, How to
Leave a comment
Tile View Sizes
Tile View is available in 3 sizes on the Market or Watch Tabs. Scans and Earnings/Dividends Calendar under the Find tab [...]
Posted in Market, Watch, Find, Scans, Calendar, Functionality, Watch List
Tagged How to, earnings, watch list, dividends, find, market, scans, calendar, navigation
Comments Off on Tile View Sizes
Smart Action Icon
The Smart Action Icon adjusts available features depending upon where you are in the trading platform. For Stocks you can [...]
Posted in Market, Watch, Find, Scans, Watch List, Find
Tagged menu, icons, find, market, watch, navigation
Leave a comment
Heat Map & Spectrum Overview
Broad Market Insight that allows you to drill down The Heat Maps are accessible in the Market tab and under Find>Explore and [...]
Posted in Market, Explore, Find, Heat Map
Tagged navigation, menu, How to, heat map, find
Leave a comment
Industry Performance Bar Chart
The Bar Chart is located on the Market Tab and updates dynamically with selected Heat Map Index and Time Frame. [...]
Spectrum Map View
In the Spectrum view, each column represents the slice of time selected: Day, Week, Month or Trailing Quarter. Once the [...]
Quote Detail without leaving the List
A quick snapshot of a stock with navigational tools. The Action Arrow Icon will provide a pop-up Quote Detail window [...]
Explore – Give it a try!
From finding the best stock in the best sector to following where the money is flowing to and from, Heat [...]
Posted in Location, Market, Uncategorized, Heat Map
Tagged heat maps, spectrum map, navigation, menu, How to
Leave a comment
Other Navigation
Icons = Navigation The Action (Arrow) icon will provide different actions depending on where you are in the platform. For [...]
Posted in Stock Research, Market, Journal, Navigation, Options - Strategies
Tagged trade, analyze, navigation, menu, How to, options, find, market
Leave a comment